MASTG-TECH-0076: Reviewing Disassembled Objective-C and Swift Code
In this section, we will manually examine an iOS application's binary code and perform static analysis. Manual analysis can be a slow process and requires immense patience. A thorough manual analysis can improve the success of dynamic analysis.
There are no hard-wired rules for performing static analysis, but there are a few rules of thumb that can be used to have a systematic approach to manual analysis:
- Understand the working of the application under evaluation - the objective of the application and how it behaves in case of wrong input.
- Explore the various strings present in the application binary. This can be very helpful, for example, for spotting interesting functionality and potential error-handling logic in the application.
- Look for functions and classes having names relevant to our goal.
- Lastly, find the various entry points into the application and follow along from there to explore the application.
Techniques discussed in this section are generic and applicable irrespective of the tools used for analysis.
Objective-C
To effectively review disassembled native code, it's essential to have a basic understanding of the Objective-C runtime. Functions like _objc_msgSend and _objc_release are particularly significant within the Objective-C runtime.
In addition to what you've learned in Disassembling Native Code, we will apply these concepts using iOS UnCrackable L1. The objective of this app is to find a secret string hidden within its binary.
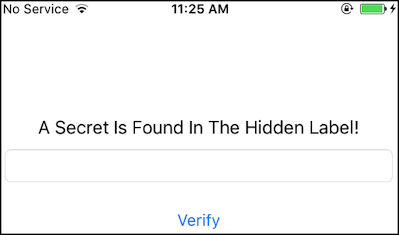
The application features a simple home screen that allows users to interact by entering custom strings in the provided text field. Our goal is to reverse-engineer the app to uncover the hidden secret string.
When the user enters an invalid string, the application displays a pop-up with the "Verification Failed" message.
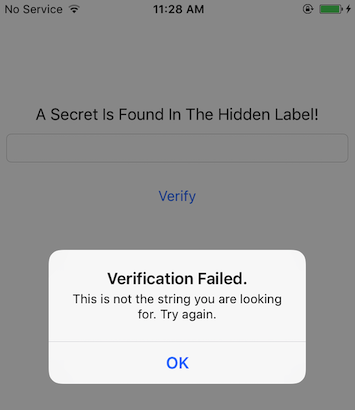
You can note the strings displayed in the pop-up, as this may help when searching for the code where the input is processed and a decision is made. Luckily, the application's complexity and interaction are straightforward, which bodes well for our reverse engineering efforts.
For static analysis in this section, we will be using Ghidra 9.0.4. Ghidra 9.1_beta auto-analysis has a bug and does not display' Objective-C classes.
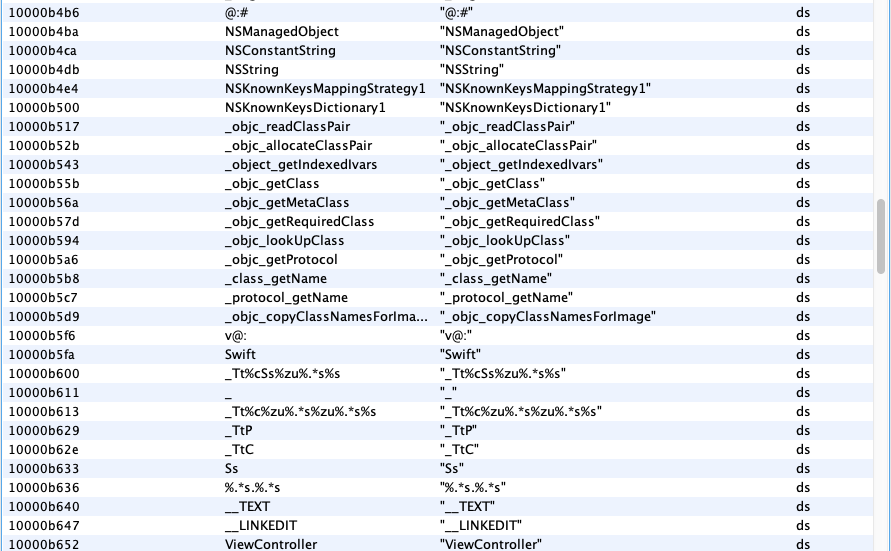
We can start by checking the strings present in the binary by opening it in Ghidra. The listed strings might be overwhelming at first, but with some experience in reversing Objective-C code, you'll learn how to filter and discard the strings that are not really helpful or relevant. For instance, the ones shown in the screenshot below are generated by the Objective-C runtime. Other strings may be beneficial in some cases, such as those containing symbols (function names, class names, etc.), and we'll use them during static analysis to check whether a specific function is being used.
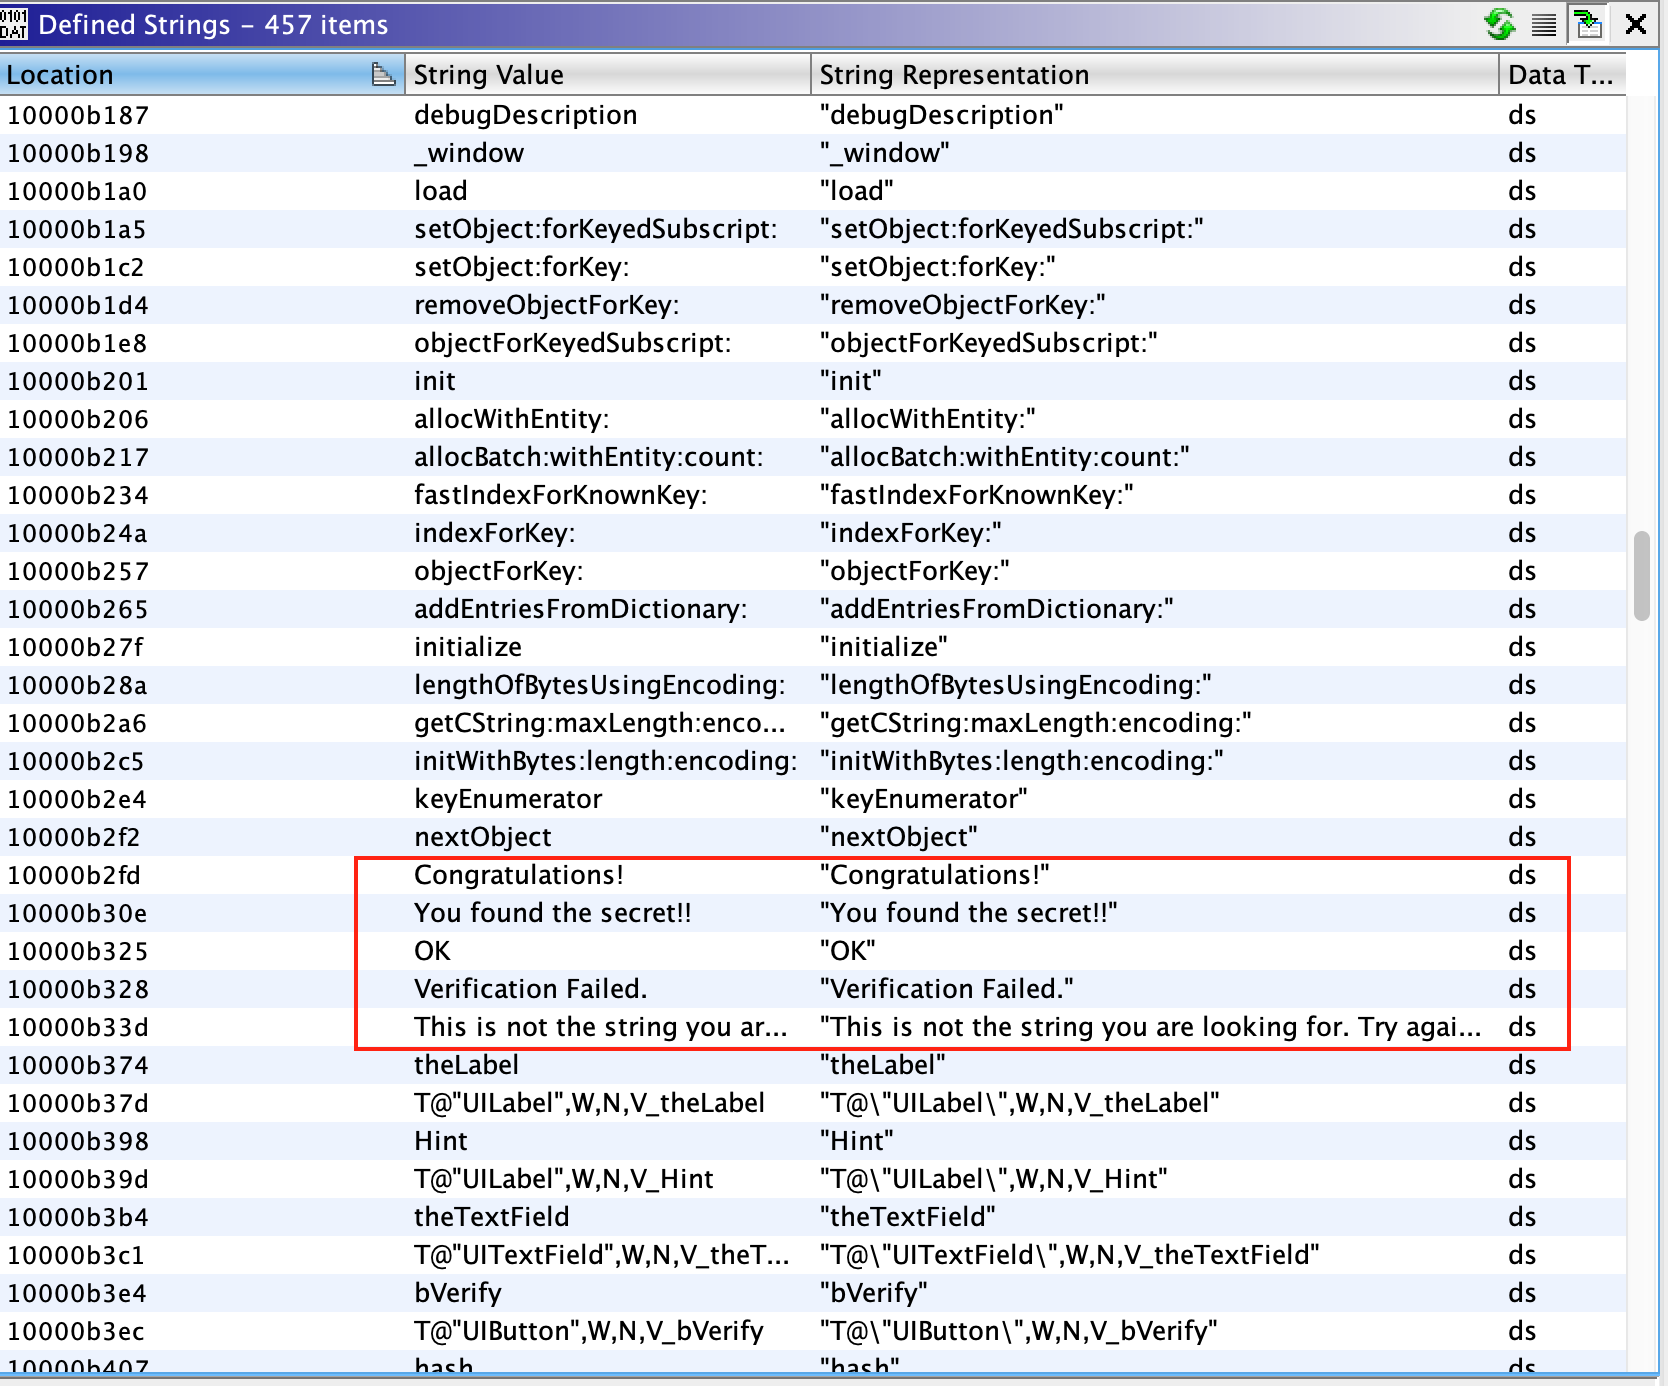
If we continue our careful analysis, we can spot the string "Verification Failed" used in the pop-up when incorrect input is provided. If you follow the cross-references (Xrefs) of this string, you will reach the buttonClick function of the ViewController class. We will look into the buttonClick function later in this section. After further reviewing the other strings in the application, only a few appear to be likely candidates for a hidden flag. You can try them and verify as well.
Moving forward, we have two paths to take. Either we can start analyzing the buttonClick function identified in the previous step, or we can start analyzing the application from various entry points. In a real-world situation, you will most often take the first path, but for learning purposes in this section, we will take the latter route.
An iOS application calls different predefined functions provided by the iOS runtime depending on its state within the application life cycle. These functions are the app's entry points. For example:
[AppDelegate application:didFinishLaunchingWithOptions:]is called when the application is started for the first time.[AppDelegate applicationDidBecomeActive:]is called when the application is moving from inactive to active state.
Many applications execute critical code in these sections. Therefore, they're a good starting point for systematically following the code.
Once we've completed the analysis of all functions in the AppDelegate class, we can conclude that there is no relevant code. The absence of any code in the functions above raises the question: from where is the application's initialization code being called?
Fortunately, the current application has a small codebase, and we can find another ViewController class in the Symbol Tree view. In this class, the function viewDidLoad looks interesting. If you check the documentation of viewDidLoad, you can see that it can also be used to perform additional initialization on views.

If we examine the decompilation of this function, we see a few interesting things. For instance, there is a call to a native function at line 31, and a label is initialized with a setHidden flag set to 1 in lines 27-29. You can keep a note of these observations and continue exploring the other functions in this class. For brevity, studying the different parts of the function is left as an exercise for the readers.
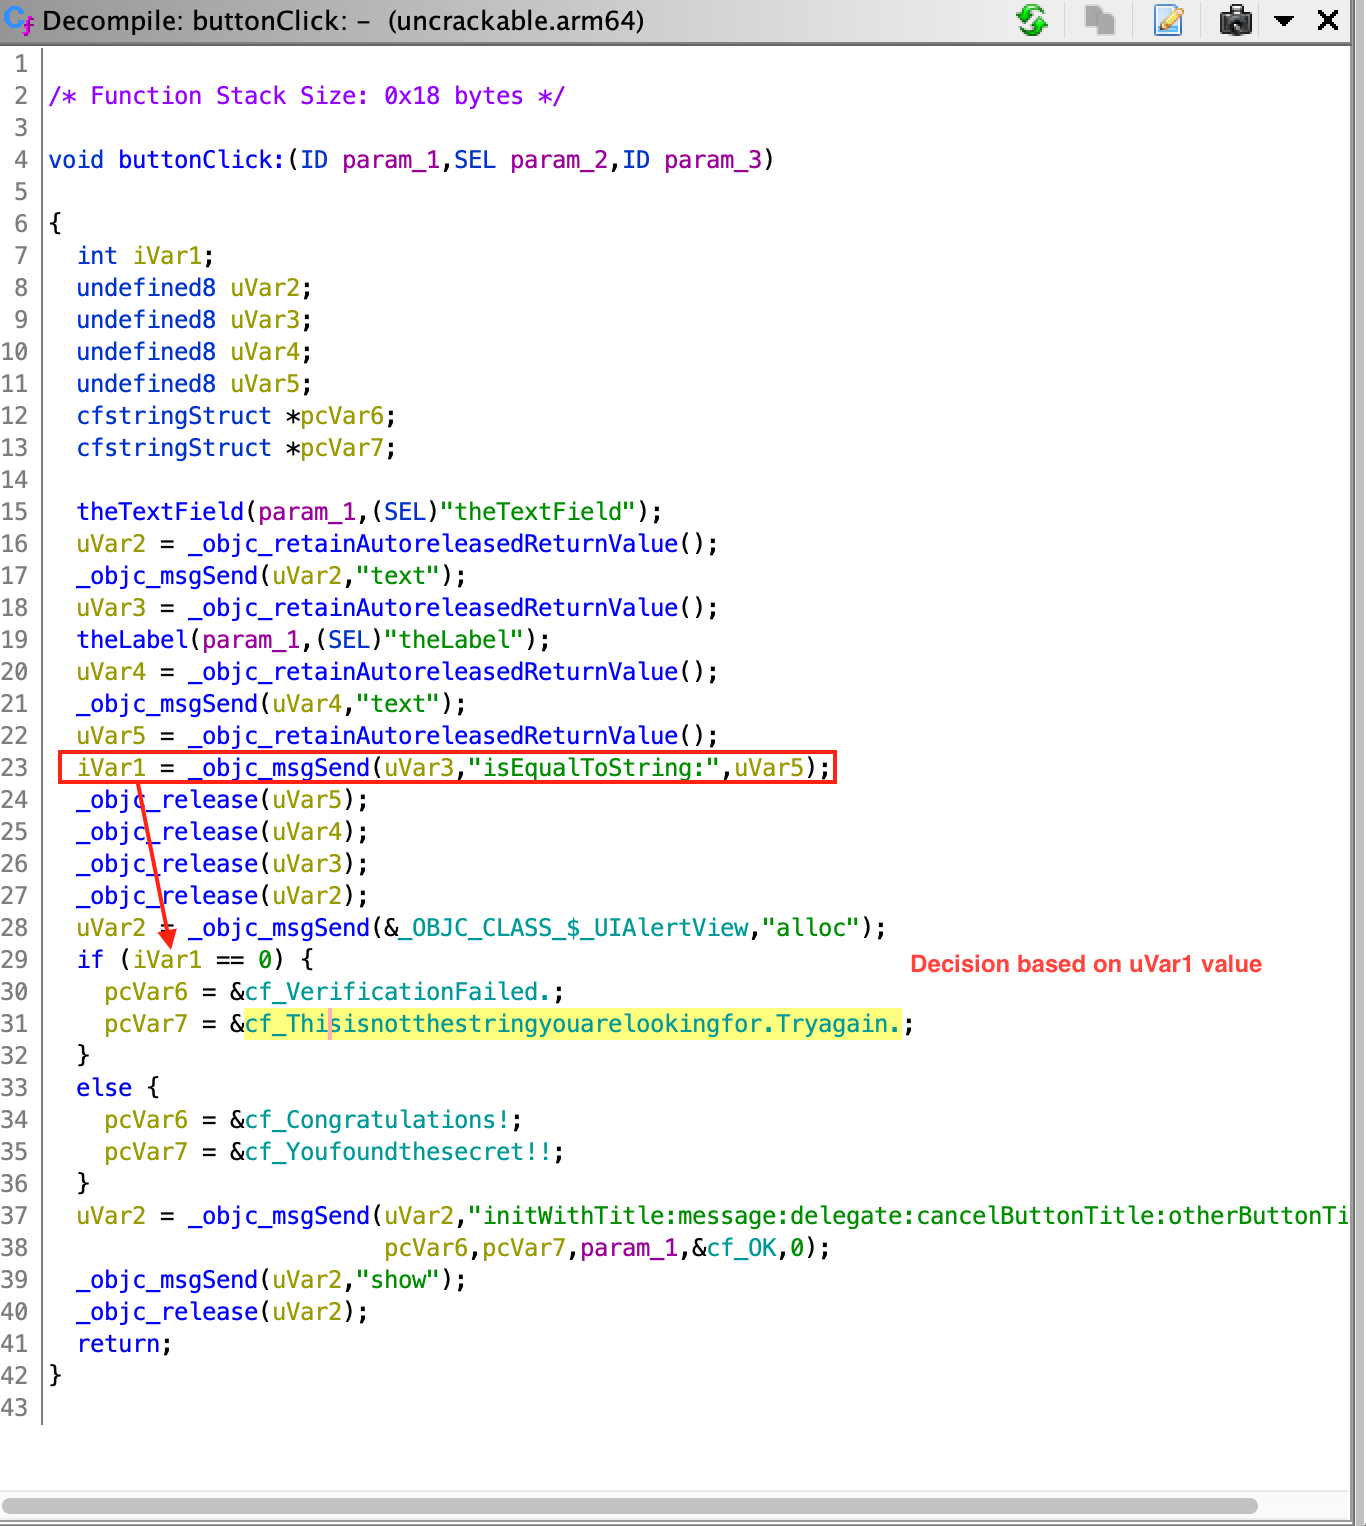
In our first step, we observed that the application verifies the input string only when the UI button is pressed. Thus, analyzing the buttonClick function is an obvious target. As mentioned earlier, this function also contains the string we see in the pop-ups. At line 29, a decision is being made, which is based on the result of isEqualString (output saved in uVar1 at line 23). The input for the comparison comes from the text input field (from the user) and from the label value. Therefore, we can assume that the hidden flag is stored in that label.
We have now completed the whole flow and have all the information about the application. We also concluded that the hidden flag is present in a text label, and to determine the label's value, we need to revisit the viewDidLoad function and understand what is happening in the identified native function. The native function is analyzed in Reviewing Disassembled Native Code.
Tests
MASTG-TEST-0385: Missing Certificate Pinning in ATS MASTG-TEST-0323: Uses of Low-Level Networking APIs for Cleartext Traffic MASTG-TEST-0343: URLSession TLS Protocol Configuration MASTG-TEST-0397: References to WKNavigationDelegate Bypassing Certificate Validation MASTG-TEST-0345: Embedded or Third-party TLS Stack Configuration MASTG-TEST-0344: Network.framework TLS Protocol Configuration MASTG-TEST-0396: References to URLSessionDelegate Bypassing Certificate Validation MASTG-TEST-0388: References to Sensitive Data Stored Unprotected in Shared App Group Containers MASTG-TEST-0313: References to APIs for Preventing Keyboard Caching of Text Fields MASTG-TEST-0384: Runtime Use of Enforced Updating APIs MASTG-TEST-0383: References to Enforced Updating APIs MASTG-TEST-0386: References to Object Deserialization of Untrusted Data MASTG-TEST-0387: References to Storage Integrity Check APIs MASTG-TEST-0401: References to Debugging Detection APIs MASTG-TEST-0358: Implementation Details Exposure Through Logging APIs MASTG-TEST-0402: Runtime Use of Debugging Detection APIs MASTG-TEST-0391: Insufficient Obfuscation of Security-Relevant Native Code MASTG-TEST-0335: WebView File Origin Access Relaxed by Configuration MASTG-TEST-0346: References to APIs Hiding Sensitive Data in Text Input Fields MASTG-TEST-0333: Overly Broad File Read Access in WebViews MASTG-TEST-0379: References to evaluateJavaScript Without Content World Isolation MASTG-TEST-0377: References to evaluateJavaScript Used as Bridge Reply in WKScriptMessageHandler MASTG-TEST-0390: Full Access Requested by a Custom Keyboard Extension MASTG-TEST-0395: Missing Input Validation in Universal Link Handlers MASTG-TEST-0376: References to Native Bridge APIs in WebViews MASTG-TEST-0332: Attacker-Controlled URI in WebViews MASTG-TEST-0276: Use of the iOS General Pasteboard MASTG-TEST-0336: Runtime Setting of Relaxed WebView File Origin Policies MASTG-TEST-0378: References to Password Fields in WebView-Loaded HTML MASTG-TEST-0380: References to evaluateJavaScript Writing Sensitive Data into WebView DOM MASTG-TEST-0389: References to the App-Wide Restriction of Custom Keyboards MASTG-TEST-0213: Use of Hardcoded Cryptographic Keys in Code MASTG-TEST-0211: Broken Hashing Algorithms MASTG-TEST-0317: Broken Symmetric Encryption Modes MASTG-TEST-0311: Insecure Random API Usage MASTG-TEST-0210: Broken Symmetric Encryption Algorithms MASTG-TEST-0214: Hardcoded Cryptographic Keys in Files MASTG-TEST-0349: Runtime Use of Insecure Random APIs
Demos
MASTG-DEMO-0154: URLSessionDelegate Accepting Any Server Certificate MASTG-DEMO-0155: WKNavigationDelegate Accepting Any Server Certificate MASTG-DEMO-0142: Sensitive Data and Functionality Exposed Through a WKWebView Native Bridge