MASTG-TECH-0035: JNI Tracing
As detailed in Reviewing Disassembled Native Code, the first argument passed to every JNI function is a JNI interface pointer. This pointer contains a table of functions that allows native code to access the Android Runtime. Identifying calls to these functions can help with understanding library functionality, such as what strings are created or Java methods are called.
jnitrace is a Frida-based tool similar to frida-trace, which specifically targets the usage of Android's JNI API by native libraries, providing a convenient way to obtain JNI method traces, including arguments and return values.
You can easily install it by running pip install jnitrace and running it straight away as follows:
jnitrace -l libnative-lib.so sg.vantagepoint.helloworldjni
The
-loption can be provided multiple times to trace multiple libraries, or*can be provided to trace all libraries. This, however, may provide a lot of output.
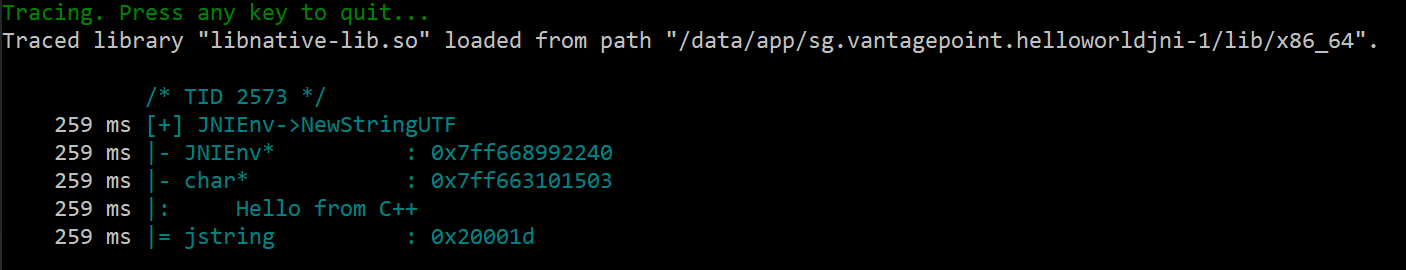
In the output, you can see the trace of a call to NewStringUTF made from the native code (its return value is then given back to Java code, see Reviewing Disassembled Native Code for more details). Note how, similarly to frida-trace, the output is colorized, helping to visually distinguish the different threads.
When tracing JNI API calls, you can see the thread ID at the top, followed by the JNI method call, including the method name, the input arguments, and the return value. In the case of a call to a Java method from native code, the Java method arguments will also be supplied. Finally, jnitrace will attempt to use the Frida backtracing library to show where the JNI call was made from.
To learn more about all options for advanced usage, check the documentation on the jnitrace GitHub page.