MASTG-TECH-0031: Debugging
So far, you've been using static analysis techniques without running the target apps. In the real world, especially when reversing malware or more complex apps, pure static analysis is very difficult. Observing and manipulating an app during runtime makes it much, much easier to decipher its behavior. Next, we'll have a look at dynamic analysis methods that help you do just that.
Android apps support two different types of debugging: Debugging on the level of the Java runtime with the Java Debug Wire Protocol (JDWP), and Linux/Unix-style ptrace-based debugging on the native layer, both of which are valuable to reverse engineers.
Debugging Release Apps
Dalvik and ART support the JDWP, a protocol for communication between the debugger and the Java virtual machine (VM) that it debugs. JDWP is a standard debugging protocol that's supported by command-line tools and Java IDEs, including jdb. Android's implementation of JDWP also includes hooks for supporting extra features that were historically implemented by the Dalvik Debug Monitor Server (DDMS), now replaced by the Android Studio profiler.
A JDWP debugger allows you to step through Java code, set breakpoints on Java methods, and inspect and modify local and instance variables. You'll use a JDWP debugger most of the time you debug "normal" Android apps (i.e., apps that don't make many calls to native libraries).
If the app is not marked as debuggable, you can patch the manifest as shown in "Patching Example: Making an App Debuggable" in Patching. However, re-signing is invasive and can cause instability or trigger app integrity checks. You can also enable debugging without re-signing:
- Hook Android framework checks so the app appears debuggable. A framework such as LSPosed can hook checks of the
FLAG_DEBUGGABLEflag inApplicationInfo. You can use a module such as debugmepLS to toggle the debuggable state so JDWP can attach. This approach requires root and a hooking framework, and apps may detect it. - Enable system-wide app debugging by changing system properties. On a rooted device in a privileged ADB shell, run
resetprop ro.debuggable 1. If this causes instability, you can temporarily set SELinux to permissive withsetenforce 0. This approach is noisy and easy for apps to detect.
In the following section, we'll show how to solve the Android UnCrackable L1 with jdb alone. Note that this is not an efficient way to solve this crackme. You can do it faster with Frida (Android) and other methods, which we'll introduce later in the guide. This, however, serves as an introduction to the capabilities of the Java debugger.
Debugging with jdb
You can use the adb command adb jdwp to list the process IDs of all debuggable processes running on the connected device (i.e., processes hosting a JDWP transport). With the adb forward command, you can open a listening socket on your host computer and forward this socket's incoming TCP connections to the JDWP transport of a chosen process.
adb jdwp
12167
adb forward tcp:7777 jdwp:12167
You're now ready to attach jdb. Attaching the debugger, however, causes the app to resume, which you don't want. You want to keep it suspended so that you can explore first. To prevent the process from resuming, pipe the suspend command into the debugger:
{ echo "suspend"; cat; } | jdb -attach localhost:7777
Initializing jdb ...
> All threads suspended.
>
You're now attached to the suspended process and ready to go ahead with the debugger commands. Entering ? prints the complete list of commands. Unfortunately, the Android VM doesn't support all available JDWP features. For example, the redefine command, which would let you redefine a class code, is not supported. Another important restriction is that line breakpoints won't work because the release bytecode doesn't contain line information. Method breakpoints do work, however. Useful working commands include:
- classes: list all loaded classes
- class/methods/fields class id: Print details about a class and list its methods and fields
- locals: print local variables in the current stack frame
- print/dump expr: print information about an object
- stop in method: set a method breakpoint
- clear method: remove a method breakpoint
- set lvalue = expr: assign new value to field/variable/array element
Let's revisit the decompiled code from the Android UnCrackable L1 and think about possible solutions. A good approach would be suspending the app in a state where the secret string is held in a variable in plain text, so you can retrieve it. Unfortunately, you won't get that far unless you deal with the root/tampering detection first.
Review the code and you'll see that the method sg.vantagepoint.uncrackable1.MainActivity.a displays the "This is unacceptable..." message box. This method creates an AlertDialog and sets a listener class for the onClick event. This class (named b) has a callback method that will terminate the app once the user taps the OK button. To prevent the user from simply canceling the dialog, the setCancelable method is called.
  private void a(final String title) {
        final AlertDialog create = new AlertDialog$Builder((Context)this).create();
        create.setTitle((CharSequence)title);
        create.setMessage((CharSequence)"This in unacceptable. The app is now going to exit.");
        create.setButton(-3, (CharSequence)"OK", (DialogInterface$OnClickListener)new b(this));
        create.setCancelable(false);
        create.show();
    }
You can bypass this with a little runtime tampering. With the app still suspended, set a method breakpoint on android.app.Dialog.setCancelable and resume the app.
> stop in android.app.Dialog.setCancelable
Set breakpoint android.app.Dialog.setCancelable
> resume
All threads resumed.
>
Breakpoint hit: "thread=main", android.app.Dialog.setCancelable(), line=1,110 bci=0
main[1]
The app is now suspended at the first instruction of the setCancelable method. You can print the arguments passed to setCancelable with the locals command (the arguments are shown incorrectly under "local variables").
main[1] locals
Method arguments:
Local variables:
flag = true
setCancelable(true) was called, so this can't be the call we're looking for. Resume the process with the resume command.
main[1] resume
Breakpoint hit: "thread=main", android.app.Dialog.setCancelable(), line=1,110 bci=0
main[1] locals
flag = false
You've now reached a call to setCancelable with the argument false. Set the variable to true with the set command and resume.
main[1] set flag = true
 flag = true = true
main[1] resume
Repeat this process, setting flag to true each time the breakpoint is reached, until the alert box is finally displayed (the breakpoint will be reached five or six times). The alert box should now be cancelable! Tap the screen next to the box, and it will close without terminating the app.
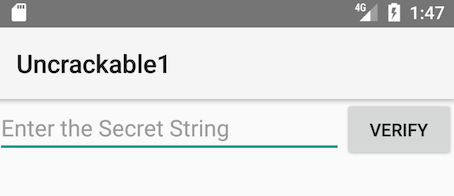
Now that the anti-tampering is out of the way, you're ready to extract the secret string! In the "static analysis" section, you saw that the string is decrypted with AES, then compared with the string input to the message box. The method equals of the java.lang.String class compares the string input with the secret string. Set a method breakpoint on java.lang.String.equals, enter an arbitrary text string in the edit field, and tap the "verify" button. Once the breakpoint is reached, you can read the method argument with the locals command.
> stop in java.lang.String.equals
Set breakpoint java.lang.String.equals
>
Breakpoint hit: "thread=main", java.lang.String.equals(), line=639 bci=2

main[1] locals
Method arguments:
Local variables:
other = "radiusGravity"
main[1] cont

Breakpoint hit: "thread=main", java.lang.String.equals(), line=639 bci=2

main[1] locals
Method arguments:
Local variables:
other = "I want to believe"
main[1] cont
This is the plaintext string you're looking for!
Debugging with an IDE
Setting up a project in an IDE with the decompiled sources is a neat trick that allows you to set method breakpoints directly in the source code. In most cases, you should be able to single-step through the app and inspect the state of variables with the GUI. The experience won't be perfect. It's not the original source code after all, so you won't be able to set line breakpoints, and things will sometimes simply not work correctly. Then again, reversing code is never easy, and efficiently navigating and debugging plain old Java code is a pretty convenient way of doing it. A similar method has been described in the NetSPI blog.
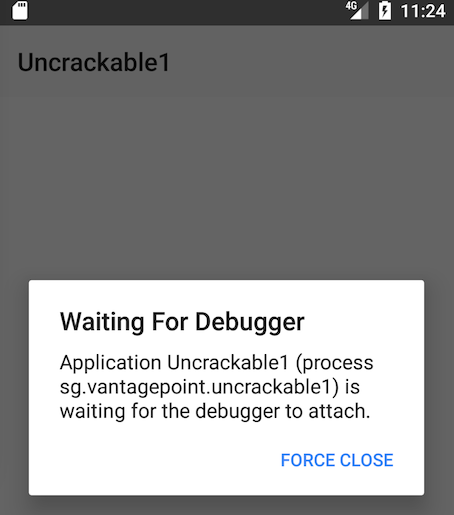
To set up IDE debugging, first create your Android project in Android Studio and copy the decompiled Java sources into the source folder as described above in the Reviewing Decompiled Java Code. On the device, choose the app as debug app on the "Developer options" ( Android UnCrackable L1 in this tutorial), and make sure you've switched on the "Wait For Debugger" feature.
Once you tap the app icon from the launcher, it will be suspended in "Wait For Debugger" mode.
Now you can set breakpoints and attach to the app process with the "Attach Debugger" toolbar button.
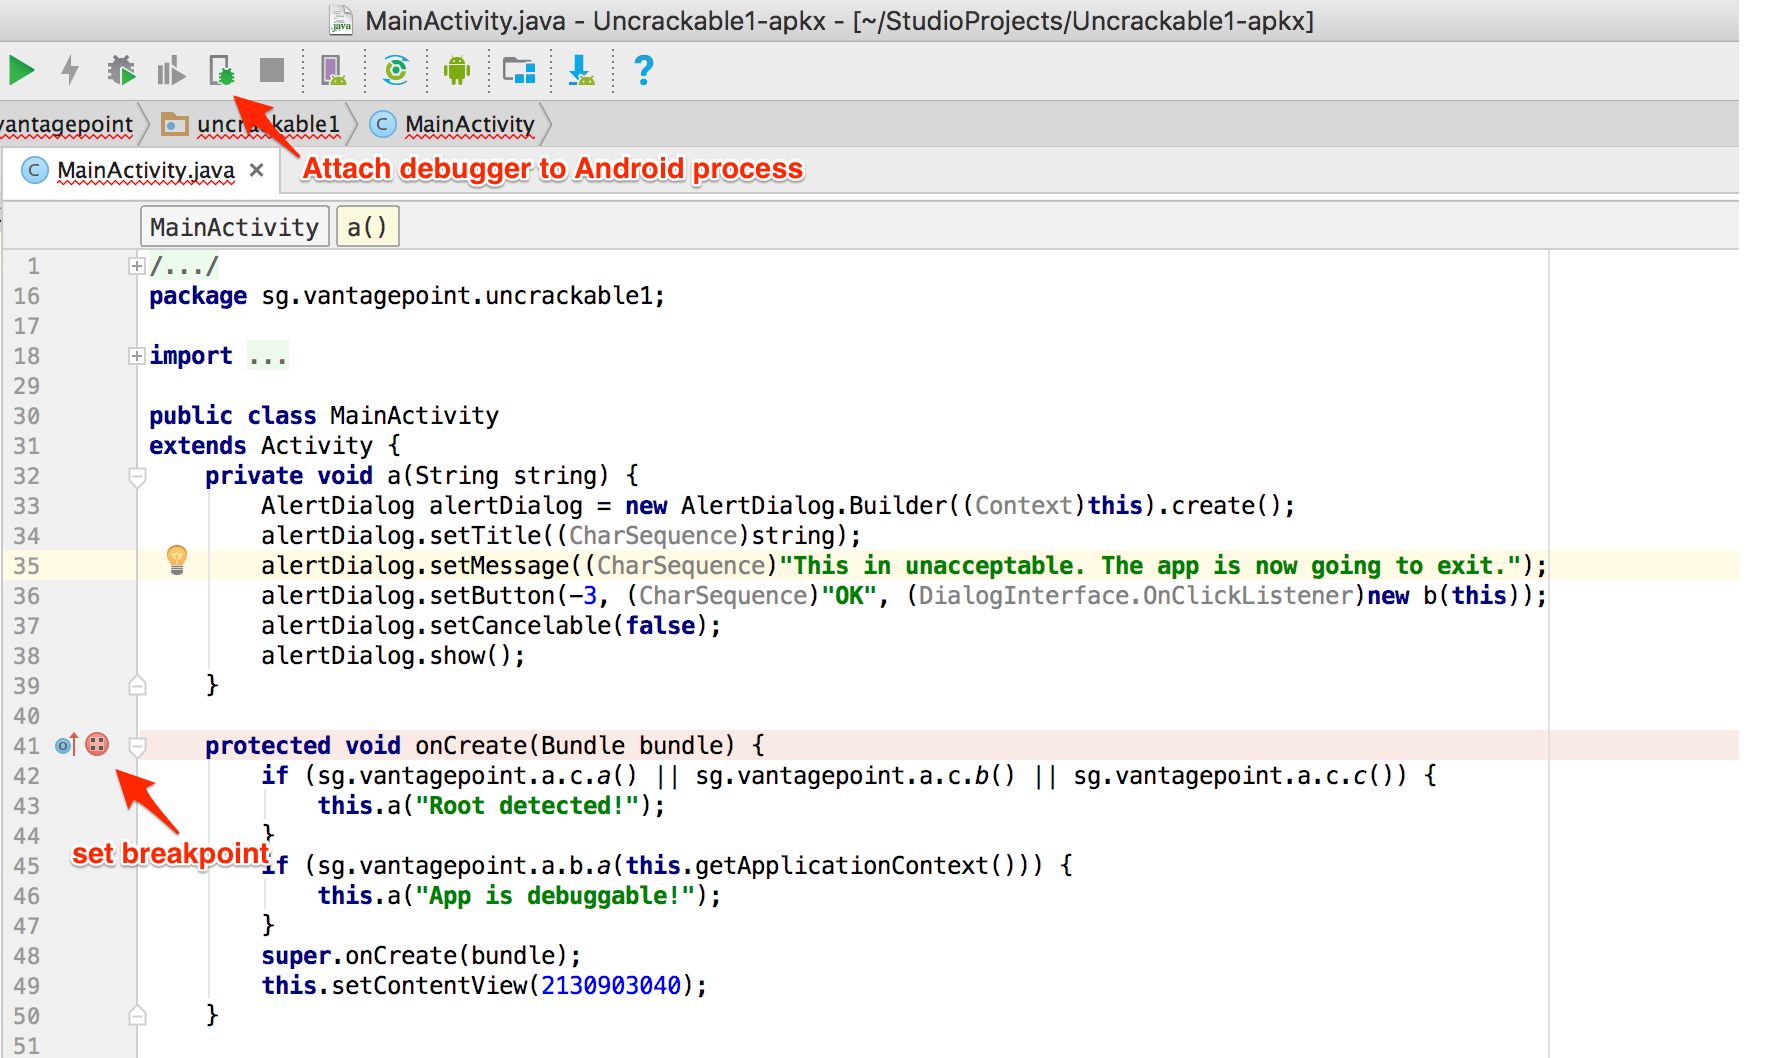
Note that only method breakpoints work when debugging an app from decompiled sources. Once a method breakpoint is reached, you'll get the chance to single-step during the method execution.
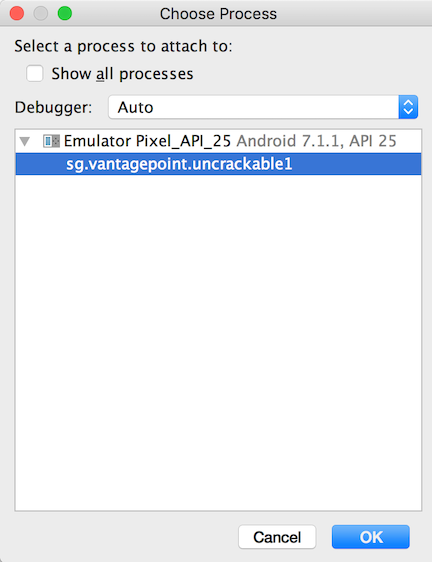
After you choose the app from the list, the debugger will attach to the app process, and you'll reach the breakpoint that was set on the onCreate method. This app triggers anti-debugging and anti-tampering controls within the onCreate method. That's why setting a breakpoint on the onCreate method just before the anti-tampering and anti-debugging checks are performed is a good idea.
Next, single-step through the onCreate method by clicking "Force Step Into" in the Debugger view. The "Force Step Into" option allows you to debug the Android framework functions and core Java classes that are normally ignored by debuggers.
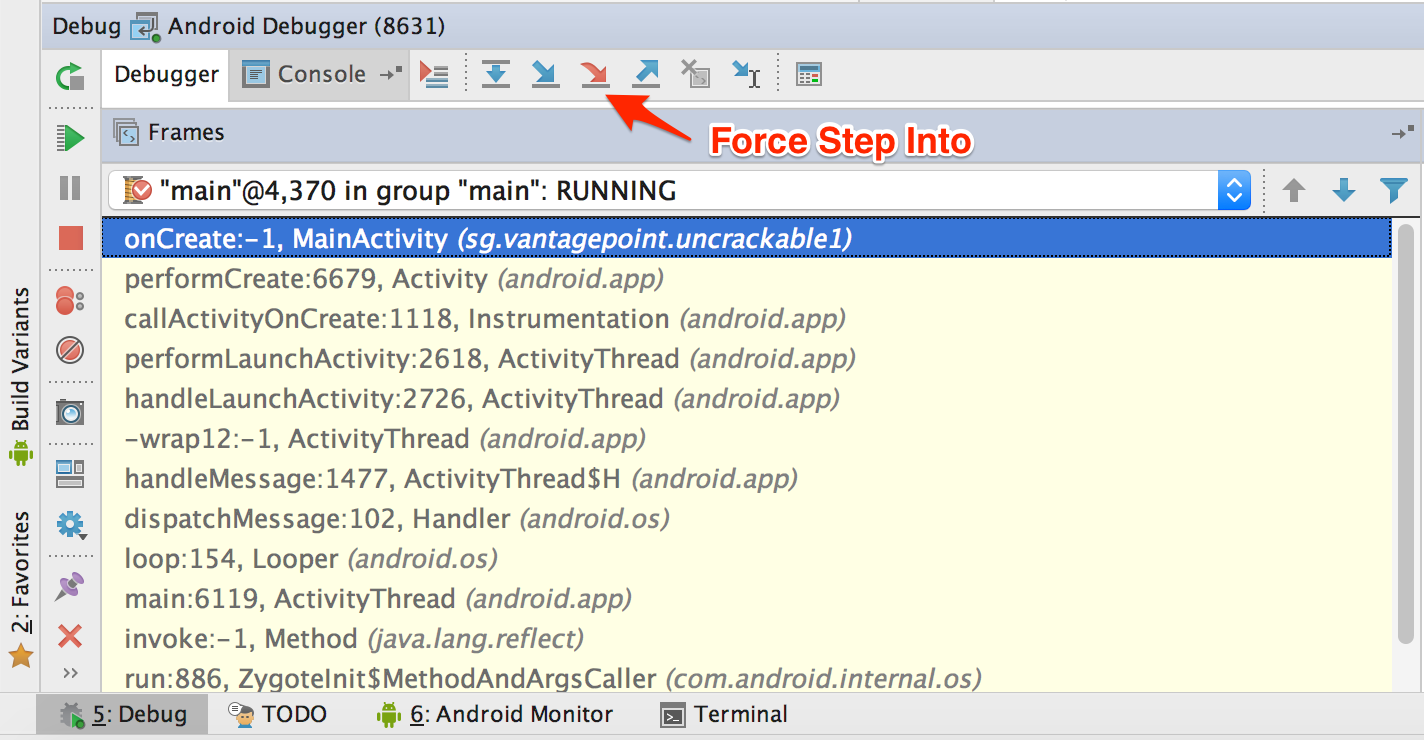
Once you "Force Step Into", the debugger will stop at the beginning of the next method, which is the a method of the class sg.vantagepoint.a.c.
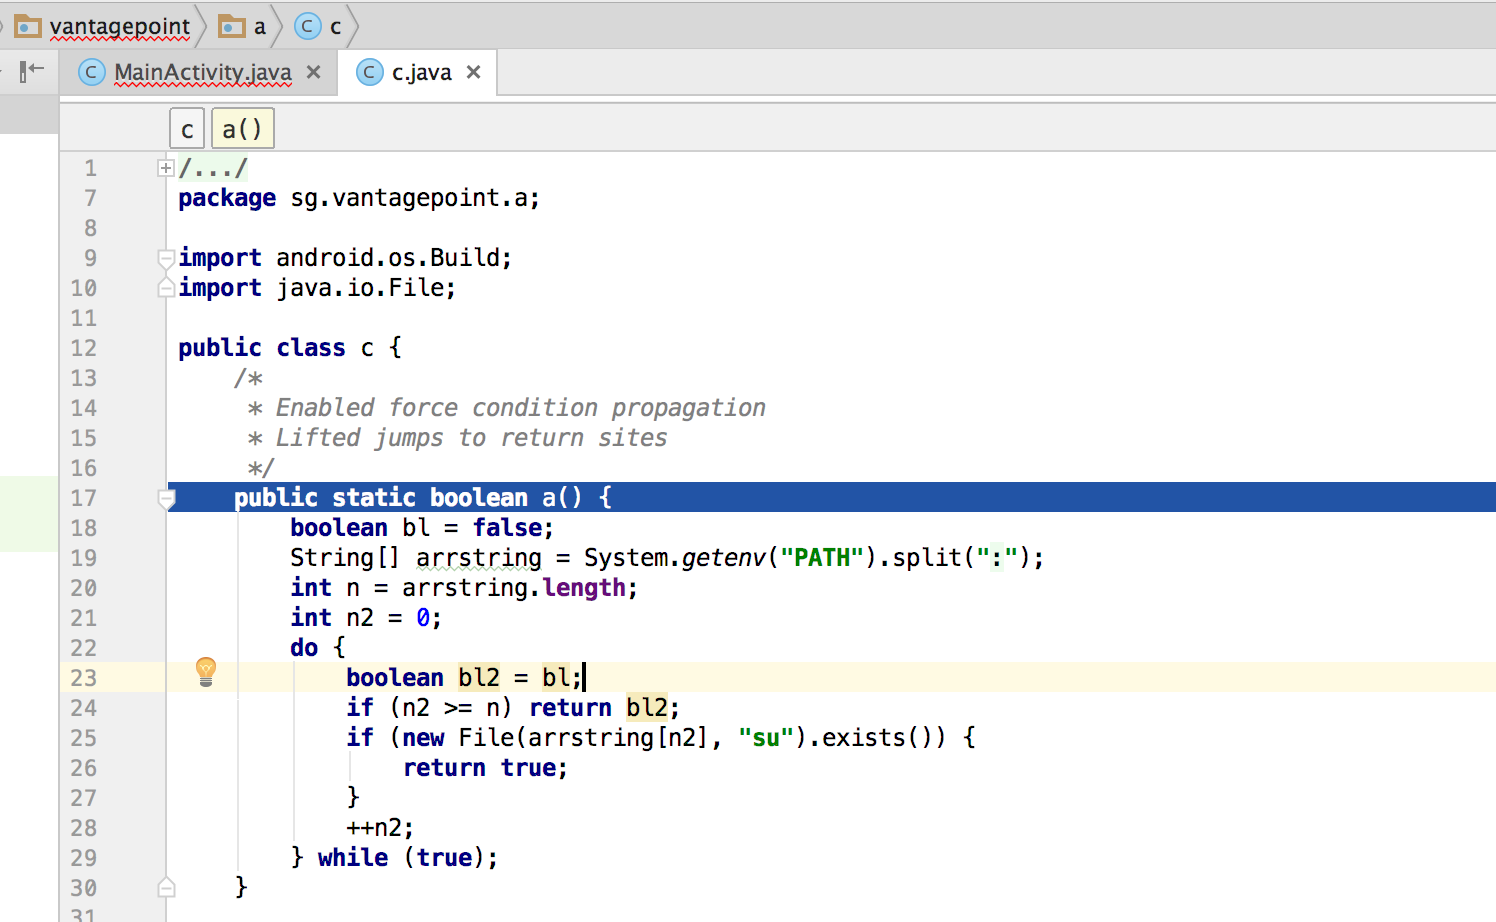
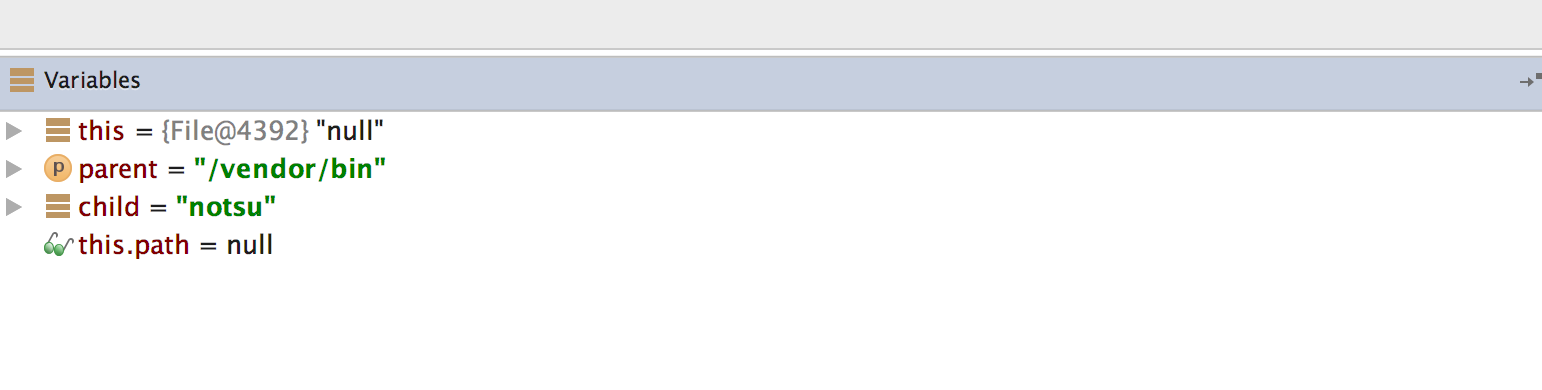
This method searches for the "su" binary within a list of directories (/system/xbin and others). Since you're running the app on a rooted device/emulator, you need to defeat this check by manipulating variables and/or function return values.
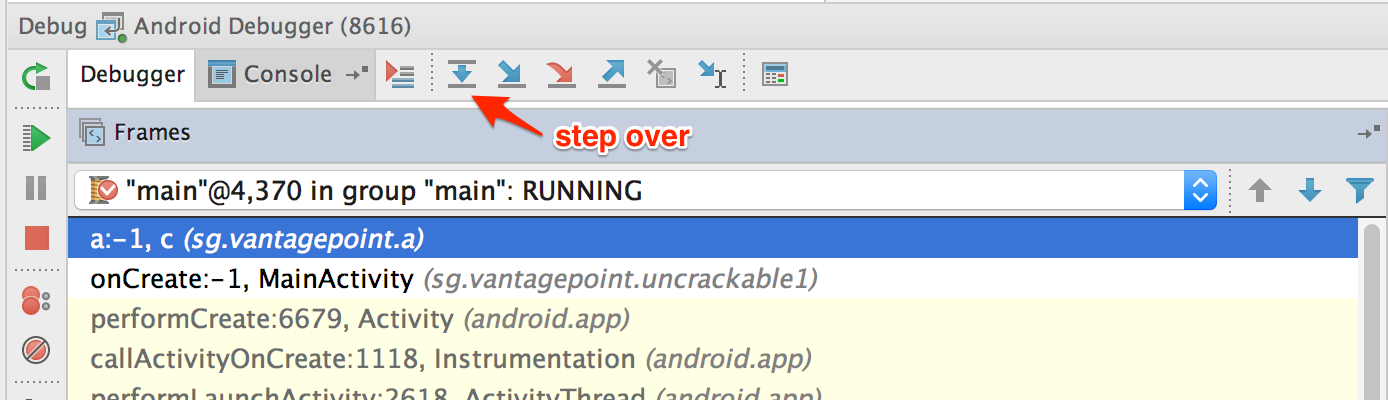
You can see the directory names inside the "Variables" window by clicking "Step Over" in the Debugger view to step into and through the a method.
Step into the System.getenv method with the "Force Step Into" feature.
After you get the colon-separated directory names, the debugger cursor will return to the beginning of the a method, not to the next executable line. This happens because you're working on the decompiled code instead of the source code. This skipping makes following the code flow crucial to debugging decompiled applications. Otherwise, identifying the next line to be executed would become complicated.
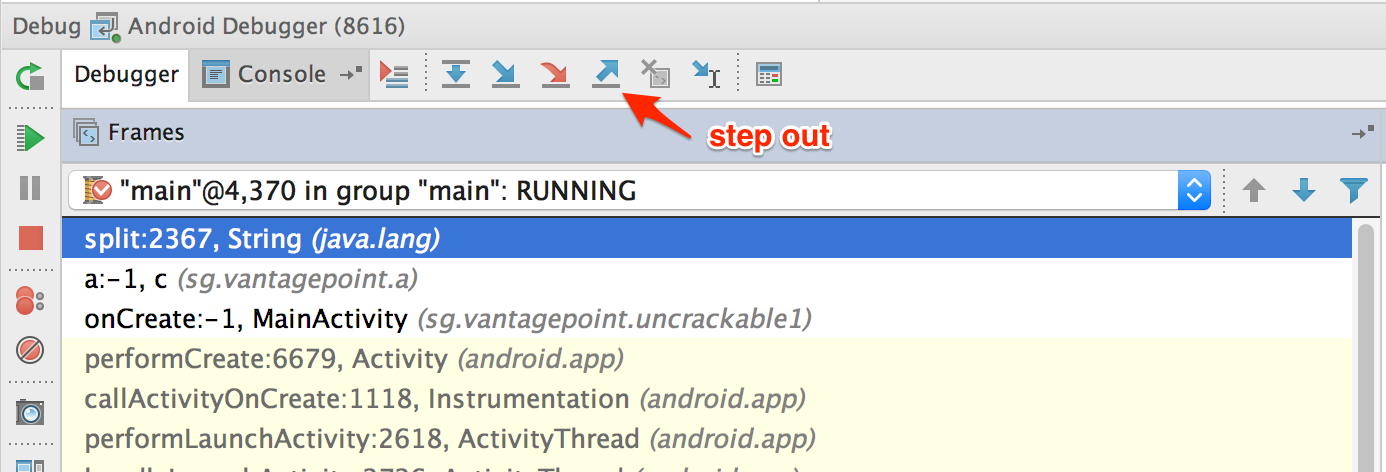
If you don't want to debug core Java and Android classes, you can step out of the function by clicking "Step Out" in the Debugger view. Using "Force Step Into" might be a good idea once you reach the decompiled sources and "Step Out" of the core Java and Android classes. This will help speed up debugging while you keep an eye on the return values of the core class functions.
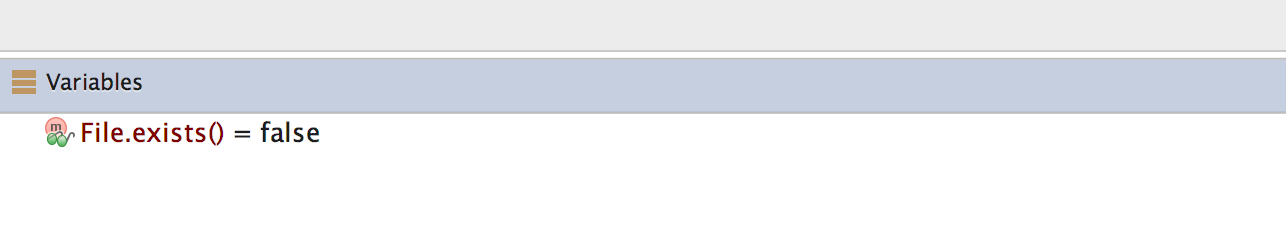
After the a method gets the directory names, it will search for the su binary within these directories. To defeat this check, step through the detection method and inspect the variable content. Once execution reaches a location where the su binary would be detected, modify one of the variables holding the file name or directory name by pressing F2 or right-clicking and choosing "Set Value".
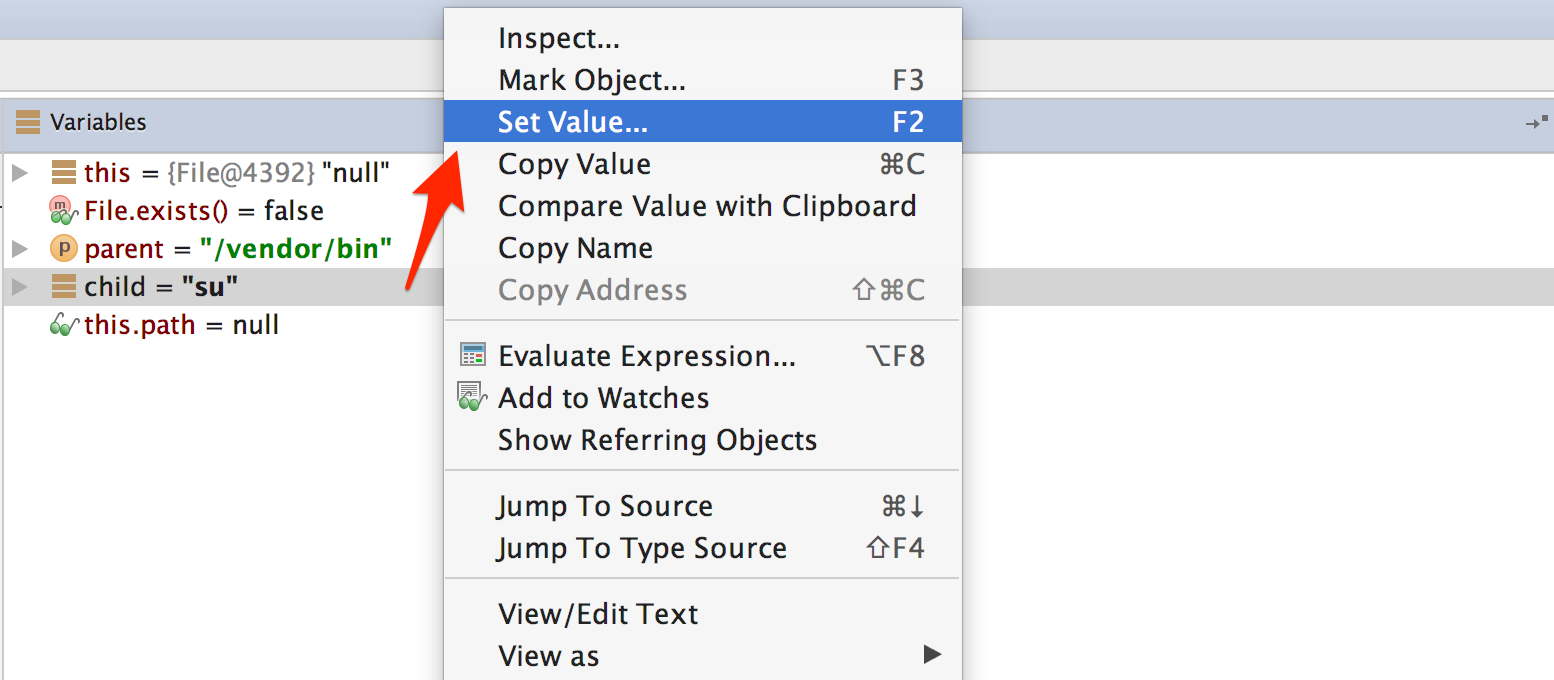
Once you modify the binary name or the directory name, File.exists should return false.
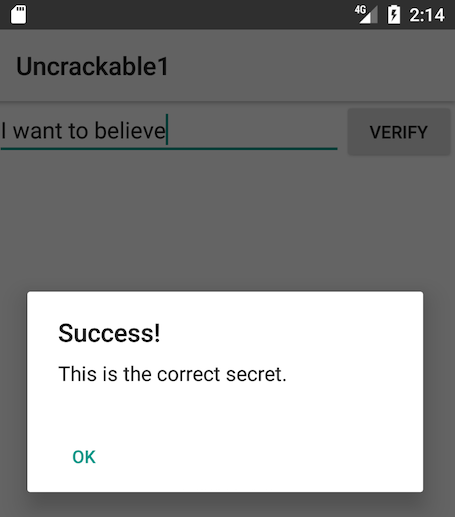
This defeats the first root detection control of the app. The remaining anti-tampering and anti-debugging controls can be defeated in similar ways so that you can finally reach the secret string verification functionality.
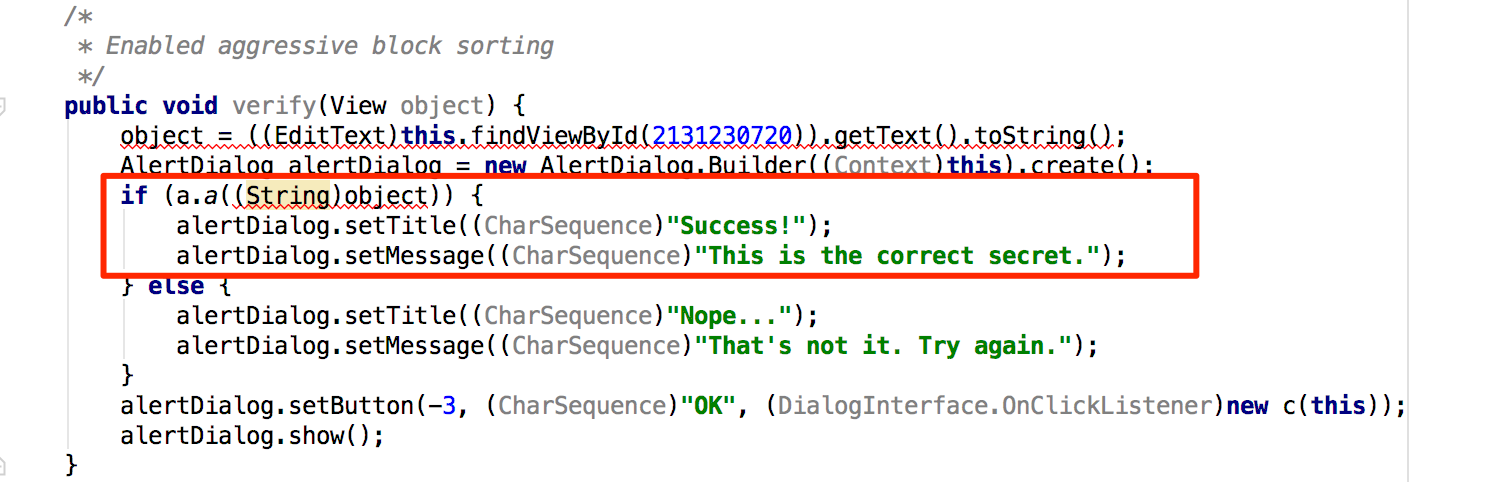
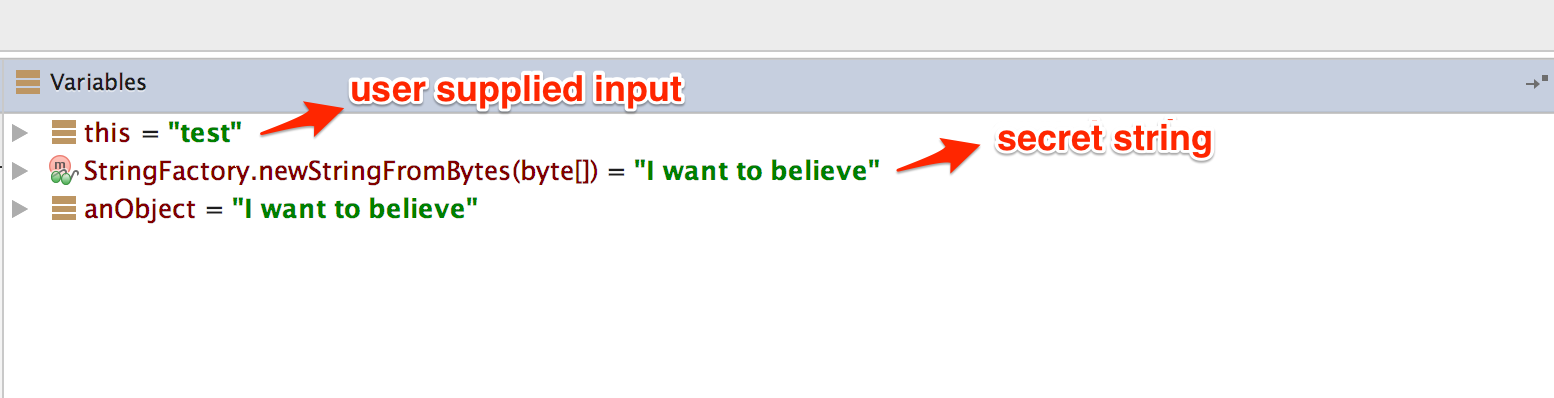
The secret code is verified by the method a of class sg.vantagepoint.uncrackable1.a. Set a breakpoint on method a and "Force Step Into" when you reach the breakpoint. Then, single-step until you reach the call to String.equals. This is where user input is compared with the secret string.
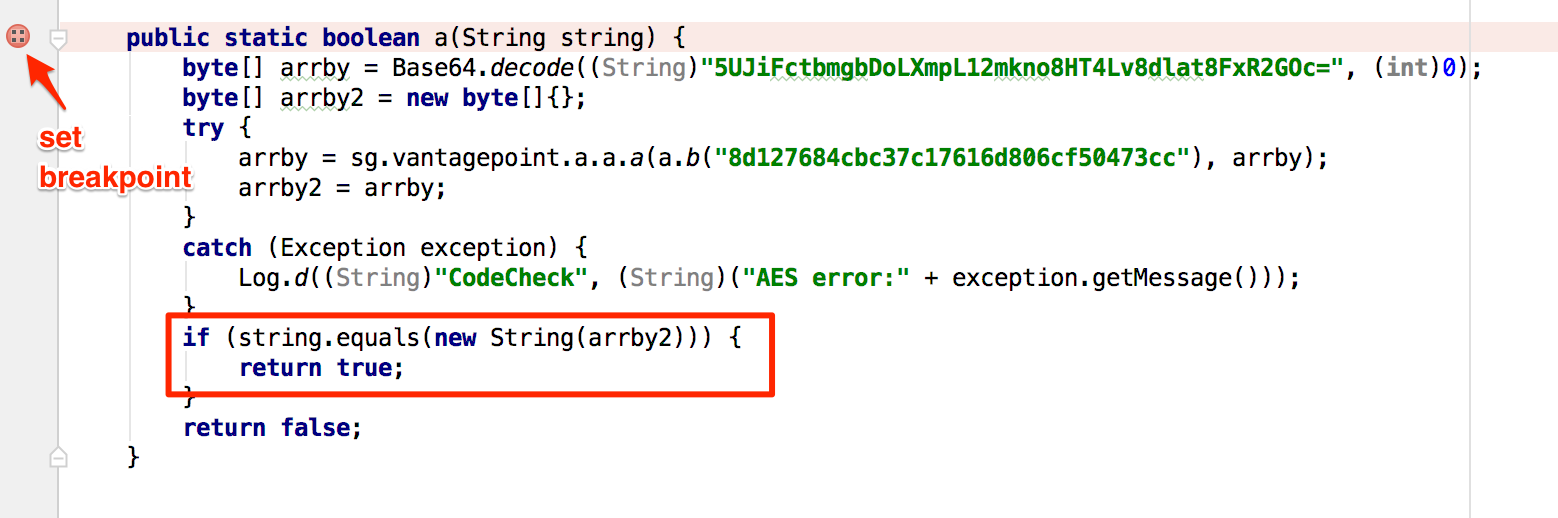
You can see the secret string in the "Variables" view when you reach the String.equals method call.
Debugging Native Code
Native code on Android is packed into ELF shared libraries and runs just like any other native Linux program. Consequently, you can debug it with standard tools as long as they support the device's processor architecture (most devices are based on ARM chipsets, so this is usually not an issue).
Warning
As stated in the official Android docs, GDB support is deprecated in favor of lldb ( lldb (Android)).
You'll now set up your JNI demo app, HelloWorld-JNI.apk, for debugging. It's the same APK you downloaded in "Statically Analyzing Native Code". Use adb install to install it on your device or on an emulator.
adb install HelloWorld-JNI.apk
If you followed the instructions at the beginning of this chapter, you should already have the Android NDK ( Android NDK). It includes lldb-server for various architectures. Copy lldb-server to your device and attach it to the target process. Start HelloWorldJNI on the device, then connect to the device and determine the PID of the HelloWorldJNI process (sg.vantagepoint.helloworldjni):
adb shell
ps | grep helloworld
u0_a164 12690 201 1533400 51692 ffffffff 00000000 S sg.vantagepoint.helloworldjni
Then switch to the root user and start lldb-server:
su
/data/local/tmp/lldb-server p --server --listen 0.0.0.0:1234
With the device connected via USB, forward the port to the host:
adb forward tcp:1234 tcp:1234
From the host, connect with lldb:
lldb
(lldb) platform select remote-android
(lldb) platform connect connect://localhost:1234
(lldb) process attach -p 12690
You have successfully attached to the process! The only problem is that you're already too late to debug the JNI function StringFromJNI; it only runs once, at startup. You can solve this problem by activating the "Wait for Debugger" option. Go to Developer Options -> Select debug app and pick HelloWorldJNI, then activate the Wait for debugger switch. Then, terminate and re-launch the app. It should be suspended automatically.
Our objective is to set a breakpoint at the first instruction of the native function Java_sg_vantagepoint_helloworldjni_MainActivity_stringFromJNI before resuming the app. Unfortunately, this isn't possible at this point in the execution because libnative-lib.so isn't yet mapped into process memory. It's loaded dynamically during runtime. To get this working, you'll first use jdb to gently change the process into the desired state.
First, resume execution of the Java VM by attaching jdb. You don't want the process to resume immediately, though, so pipe the suspend command into the debugger:
adb jdwp
adb forward tcp:7777 jdwp:14342
{ echo "suspend"; cat; } | jdb -attach localhost:7777
14342
Next, suspend the process where the Java runtime loads libnative-lib.so. In the debugger, set a breakpoint at the java.lang.System.loadLibrary method and resume the process. After the breakpoint has been reached, execute the step up command, which will resume the process until loadLibrary returns. At this point, libnative-lib.so has been loaded.
> stop in java.lang.System.loadLibrary
> resume
> step up
All threads resumed.
Breakpoint hit: "thread=main", java.lang.System.loadLibrary(), line=988 bci=0
> step up
main[1] step up
>
Step completed: "thread=main", sg.vantagepoint.helloworldjni.MainActivity.<clinit>(), line=12 bci=5

main[1]
Execute lldb-server to attach to the suspended app. This will cause the app to be suspended by both the Java VM and the Linux kernel (creating a state of "double-suspension").
adb forward tcp:1234 tcp:1234
lldb
(lldb) platform select remote-android
(lldb) platform connect connect://localhost:1234
(lldb) process attach -p 12690
Using lldb (Android)
Attaching to a Non-Debuggable App
Below are example steps to attach lldb (Android) to a running, non-debuggable app. Since we are targeting an application built without android:debuggable="true", we will need root access to successfully attach a debugger to its process:
- Spawn a root ADB shell using
adb shellandsu. - Run
lldb-server p --server --listen 0.0.0.0:1234. This will start the lldb server, listening for connections from all addresses on port1234. Using any other accessible port is also correct. - Use adb to forward connections to the
1234port by runningadb forward tcp:1234 tcp:1234. - From the host, connect to the lldb server by starting lldb and running the following commands inside, where
$TARGET_PIDis the pid of the process to debug:
(lldb) platform select remote-android
(lldb) platform connect connect://localhost:1234
(lldb) process attach -p $TARGET_PID
Attaching to a Debuggable App
If the target app is debuggable, you can also run lldb-server in the app context with run-as and debug without root.
Set the target package name first:
- Copy
lldb-serverinto the app data directory:adb shell run-as "$PACKAGE_NAME" cp /data/local/tmp/lldb-server "/data/data/$PACKAGE_NAME/" - Make it executable:
adb shell run-as "$PACKAGE_NAME" chmod 700 "/data/data/$PACKAGE_NAME/lldb-server" - Start
lldb-serverfrom the app context:adb shell run-as "$PACKAGE_NAME" "/data/user/0/$PACKAGE_NAME/lldb-server" platform --server --listen "*:1234" - Forward the port from device to host:
adb forward tcp:1234 tcp:1234 - Spawn the target application.
- From the host, connect and attach from lldb:
(lldb) platform select remote-android
(lldb) platform connect connect://localhost:1234
(lldb) process attach -p $TARGET_PID