MASTG-TECH-0034: Native Code Tracing
Native methods tracing can be performed with relative ease compared to Java method tracing. frida-trace is a CLI tool for dynamically tracing function calls. It makes tracing native functions trivial and can be very useful for collecting information about an application.
For detailed tutorials on using frida-trace, see the frida-trace section in the Frida Handbook.
In order to use frida-trace, a Frida server should be running on the device. An example for tracing libc's open function using frida-trace is demonstrated below, where -U connects to the USB device and -i specifies the function to be included in the trace.
frida-trace -U -i "open" com.android.chrome
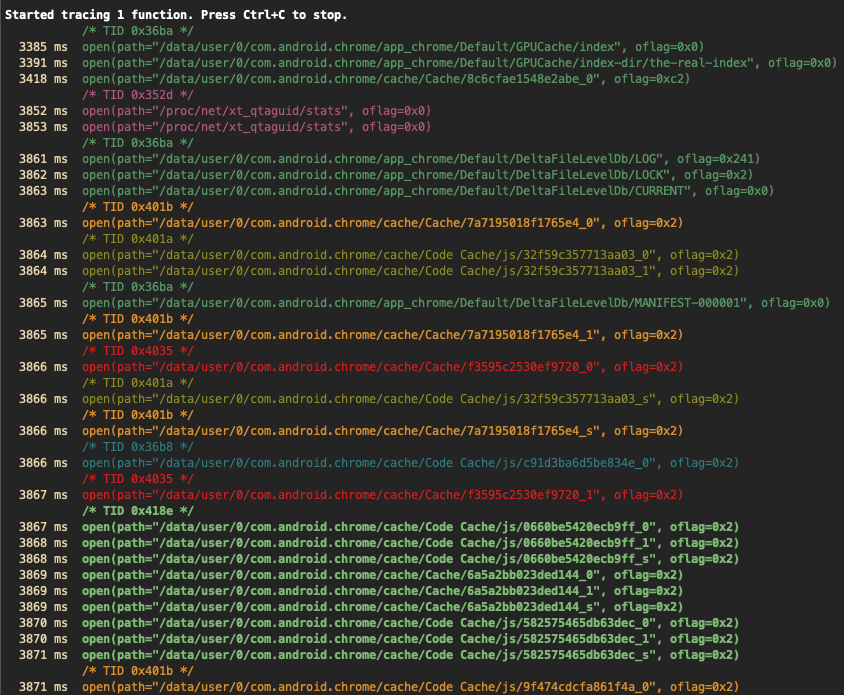
Note how, by default, only the arguments passed to the function are shown, but not the return values. Under the hood, frida-trace generates one little JavaScript handler file per matched function in the auto-generated __handlers__ folder, which Frida then injects into the process. You can edit these files for more advanced usage, such as obtaining the return value of the functions, their input parameters, accessing the memory, etc. Check Frida's JavaScript API for more details.
In this case, the generated script which traces all calls to the open function in libc.so is located in __handlers__/libc.so/open.js, it looks as follows:
{
  onEnter: function (log, args, state) {
    log('open(' +
      'path="' + args[0].readUtf8String() + '"' +
      ', oflag=' + args[1] +
    ')');
  },


  onLeave: function (log, retval, state) {
      log('\t return: ' + retval);      \\ edited
  }
}
In the above script, onEnter takes care of logging the calls to this function and its two input parameters in the right format. You can edit the onLeave event to print the return values as shown above.
Note
libc is a well-known library. Frida can automatically derive the input parameters of its open function and correctly log them. But this won't be the case for other libraries or for Android Kotlin/Java code. In that case, you may want to obtain the signatures of the functions you're interested in by referring to the Android Developer documentation or by reverse-engineering the app first.
Another thing to notice in the output above is that it's colorized. An application can have multiple threads running, and each thread can call the open function independently. By using such a color scheme, the output can be easily visually segregated for each thread.
frida-trace is a very versatile tool, and there are multiple configuration options available, such as:
- Including
-Iand excluding-Xentire modules. - Tracing all JNI functions in an Android application using
-i "Java_*"(note the use of a glob*to match all possible functions starting with "Java_"). - Tracing functions by address when no function name symbols are available (stripped binaries), e.g.
-a "libjpeg.so!0x4793c".
frida-trace -U -i "Java_*" com.android.chrome
Many binaries are stripped and don't have function name symbols available with them. In such cases, a function can be traced using its address as well.
frida-trace -p 1372 -a "libjpeg.so!0x4793c"