MASTG-TECH-0084: Debugging
Coming from a Linux background, you'd expect the ptrace system call to be as powerful as you're used to, but, for some reason, Apple decided to leave it incomplete. iOS debuggers such as LLDB use it to attach, step, or continue the process, but they cannot use it to read or write memory (all PT_READ_* and PT_WRITE* requests are missing). Instead, they have to get a so-called Mach task port (by calling task_for_pid with the target process ID) and then use the Mach IPC interface API functions to perform actions such as suspending the target process and reading/writing register states (thread_get_state/thread_set_state) and virtual memory (mach_vm_read/mach_vm_write).
For more information you can refer to the LLVM project in GitHub which contains the source code for LLDB as well as Chapter 5 and 13 from "Mac OS X and iOS Internals: To the Apple's Core" [#levin] and Chapter 4 "Tracing and Debugging" from "The Mac Hacker's Handbook" [#miller].
Debugging with LLDB
The default debugserver executable that Xcode installs can't be used to attach to arbitrary processes (it is usually used only for debugging self-developed apps deployed with Xcode). To enable debugging of third-party apps, the task_for_pid-allow entitlement must be added to the debugserver executable so that the debugger process can call task_for_pid to obtain the target Mach task port, as described earlier. An easy way to do this is to add the entitlement to the debugserver binary shipped with Xcode.
To obtain the executable, mount the following DMG image:
/Applications/Xcode.app/Contents/Developer/Platforms/iPhoneOS.platform/DeviceSupport/<target-iOS-version>/DeveloperDiskImage.dmg
You'll find the debugserver executable in the /usr/bin/ directory on the mounted volume. Copy it to a temporary directory, then create a file called entitlements.plist with the following content:
<?xml version="1.0" encoding="UTF-8"?>
<!DOCTYPE plist PUBLIC "-//Apple//DTD PLIST 1.0//EN" "http://www.apple.com/DTDs/ PropertyList-1.0.dtd">
<plist version="1.0">
<dict>
    <key>com.apple.springboard.debugapplications</key>
    <true/>
    <key>run-unsigned-code</key>
    <true/>
    <key>get-task-allow</key>
    <true/>
    <key>task_for_pid-allow</key>
    <true/>
</dict>
</plist>
Apply the entitlement with codesign:
codesign -s - --entitlements entitlements.plist -f debugserver
Copy the modified binary to any directory on the test device. The following examples use usbmuxd to forward a local port through USB.
iproxy 2222 22
scp -P 2222 debugserver root@localhost:/tmp/
Note: On iOS 12 and later, follow this procedure to sign the debugserver binary obtained from the Xcode image.
1) Copy the debugserver binary to the device via scp, for example, in the /tmp folder.
2) Connect to the device via SSH and create the file, named entitlements.xml, with the following content:
<!DOCTYPE plist PUBLIC "-//Apple//DTD PLIST 1.0//EN http://www.apple.com/DTDs/PropertyList-1.0.dtd">
<plist version="1.0">
<dict>
   <key>platform-application</key>
   <true/>
   <key>com.apple.private.security.no-container</key>
   <true/>
   <key>com.apple.private.skip-library-validation</key>
   <true/>
   <key>com.apple.backboardd.debugapplications</key>
   <true/>
   <key>com.apple.backboardd.launchapplications</key>
   <true/>
   <key>com.apple.diagnosticd.diagnostic</key>
   <true/>
   <key>com.apple.frontboard.debugapplications</key>
   <true/>
   <key>com.apple.frontboard.launchapplications</key>
   <true/>
   <key>com.apple.security.network.client</key>
   <true/>
   <key>com.apple.security.network.server</key>
   <true/>
   <key>com.apple.springboard.debugapplications</key>
   <true/>
   <key>com.apple.system-task-ports</key>
   <true/>
   <key>get-task-allow</key>
   <true/>
   <key>run-unsigned-code</key>
   <true/>
   <key>task_for_pid-allow</key>
   <true/>
</dict>
</plist>
3) Type the following command to sign the debugserver binary using ldid:
ldid -Sentitlements.xml debugserver
4) Verify that the debugserver binary can be executed via the following command:
./debugserver
You can now attach debugserver to any process running on the device.
VP-iPhone-18:/tmp root# ./debugserver *:1234 -a 2670
debugserver-@(#)PROGRAM:debugserver  PROJECT:debugserver-320.2.89
for armv7.
Attaching to process 2670...
With the following command, you can launch an application via debugserver running on the target device:
debugserver -x backboard *:1234 /Applications/MobileSMS.app/MobileSMS
Attach to an already running application:
debugserver *:1234 -a "MobileSMS"
You may connect now to the iOS device from your host computer:
(lldb) process connect connect://<ip-of-ios-device>:1234
Typing image list lists the main executable and all dependent libraries.
Debugging Release Apps
In the previous section, we learned about how to set up a debugging environment on an iOS device using LLDB. In this section, we will use this information and learn how to debug a third-party release application. We will continue using iOS UnCrackable L1 and debug it.
In contrast to a debug build, code compiled for a release build is optimized for maximum performance and minimal binary size. As a general best practice, most debug symbols are stripped in release builds, which adds complexity when reverse-engineering and debugging binaries.
Because the debug symbols are missing, symbol names are absent from the backtraces, and setting breakpoints using function names is not possible. Fortunately, debuggers also support setting breakpoints directly on memory addresses. In the remainder of this section, we will learn how to do so and ultimately solve the crackme challenge.
Some groundwork is needed before setting a breakpoint using memory addresses. It requires determining two offsets:
- Breakpoint offset: The address offset of the code where we want to set a breakpoint. This address is obtained by static code analysis using a disassembler such as Ghidra.
- ASLR shift offset: The ASLR shift offset for the current process. Since the ASLR offset is randomly generated on each application instance, it must be obtained for each debugging session. This is determined using the debugger itself.
iOS is a modern operating system that uses multiple techniques to mitigate code-execution attacks, including Address Space Layout Randomization (ASLR). On each application execution, a random ASLR shift offset is generated, which shifts various process data structures.
The final breakpoint address to be used in the debugger is the sum of the above two addresses (Breakpoint offset and ASLR shift offset). This approach assumes that the image base address (discussed shortly) used by the disassembler and iOS is the same, which is true most of the time.
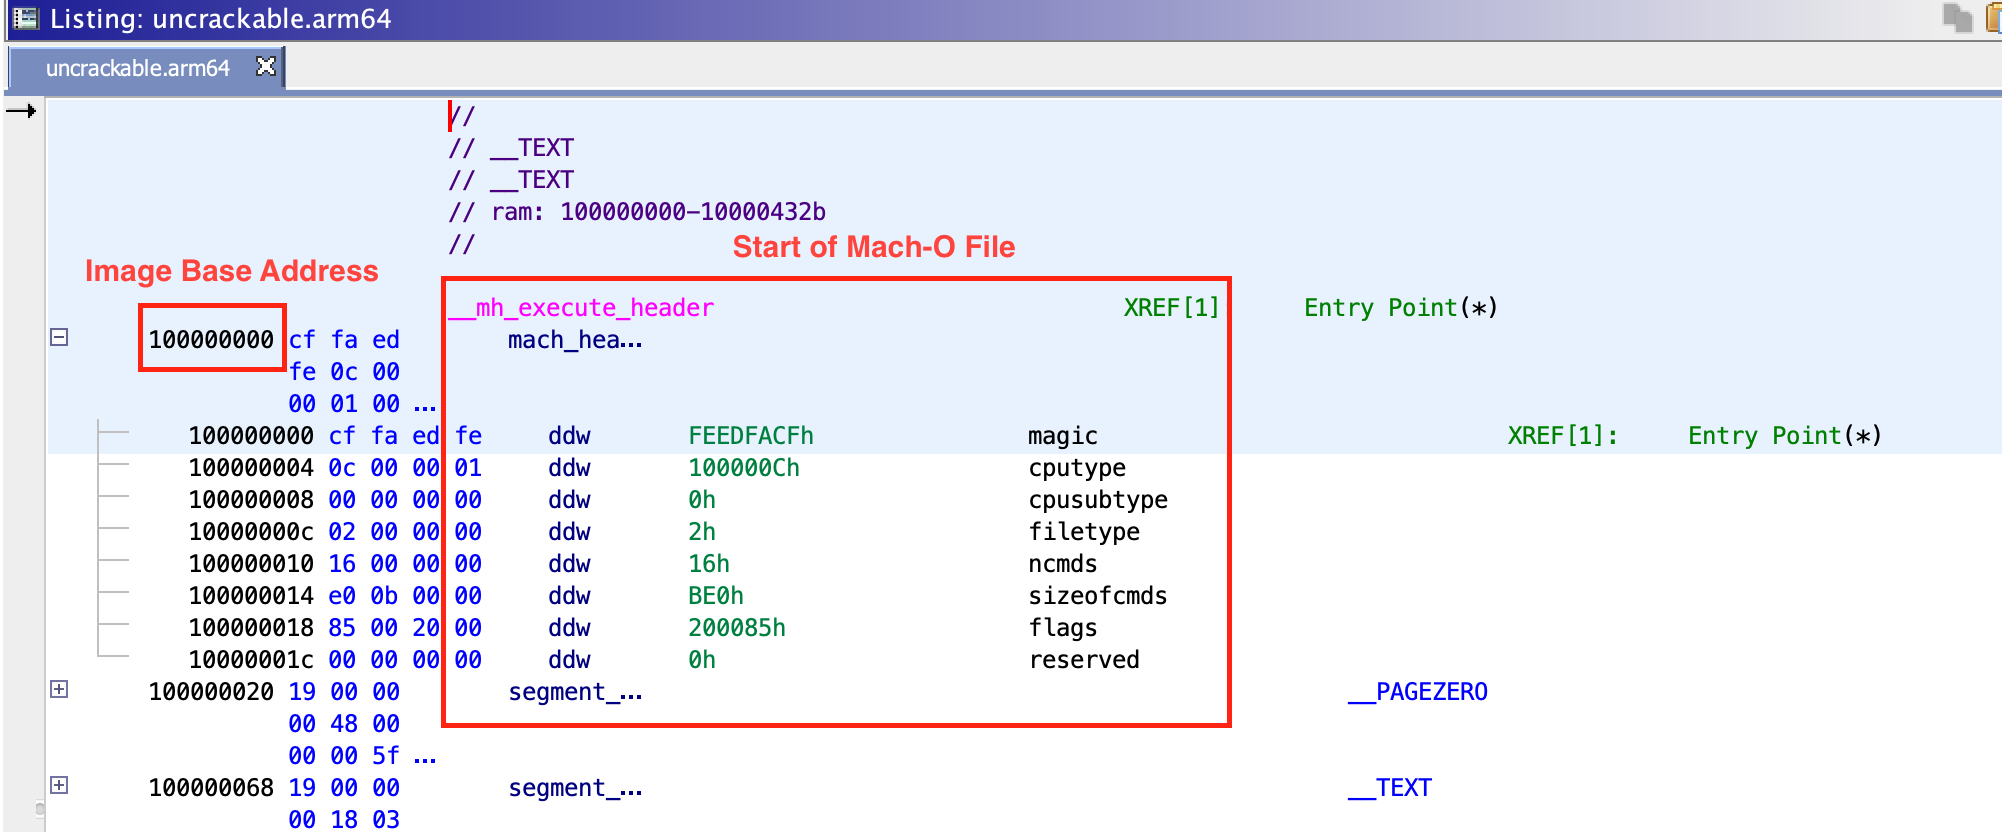
When a binary is opened in a disassembler like Ghidra, it is loaded by emulating the operating system loader. The address at which the binary is loaded is called the image base address. All code and symbols in this binary can be addressed using a constant offset from the image base address. In Ghidra, the image base address can be obtained by determining the start address of a Mach-O file. In this case, it is 0x100000000.
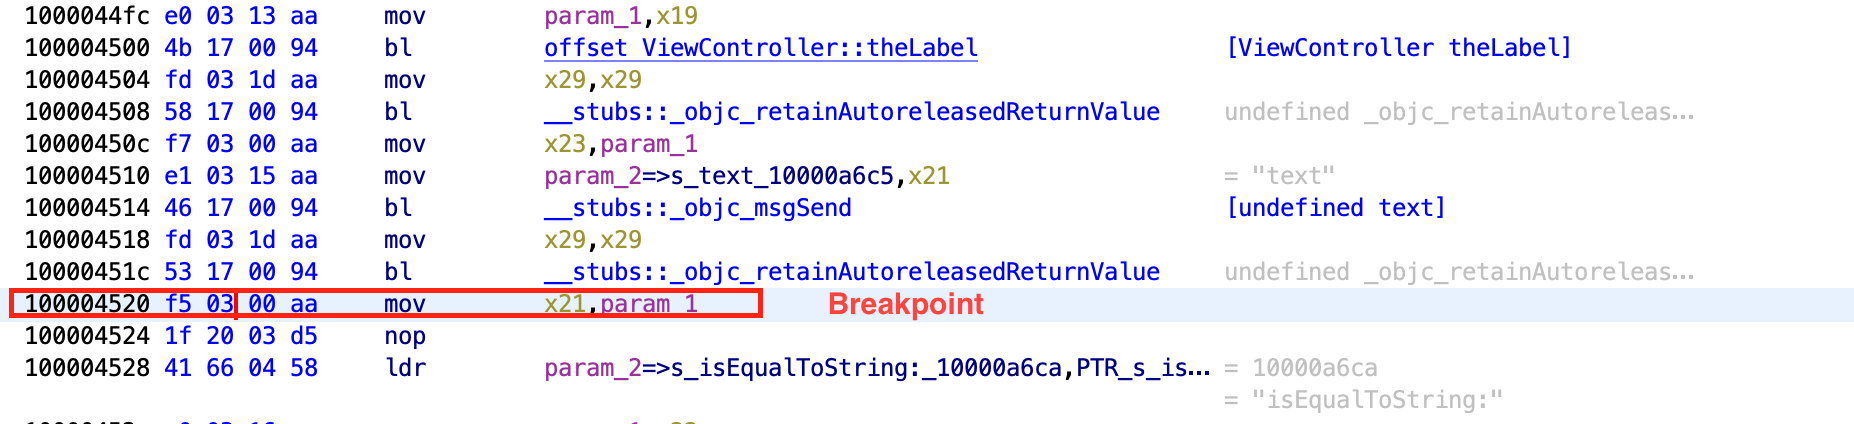
The value of the hidden string is stored in a label with the hidden flag set. During disassembly, the text value of this label is stored in register X21 via mov from X0 at offset 0x100004520. This is our breakpoint offset.
For the second address, we need to determine the ASLR shift offset for a given process. The ASLR offset can be determined by using the LLDB command image list -o -f. The output is shown in the screenshot below.
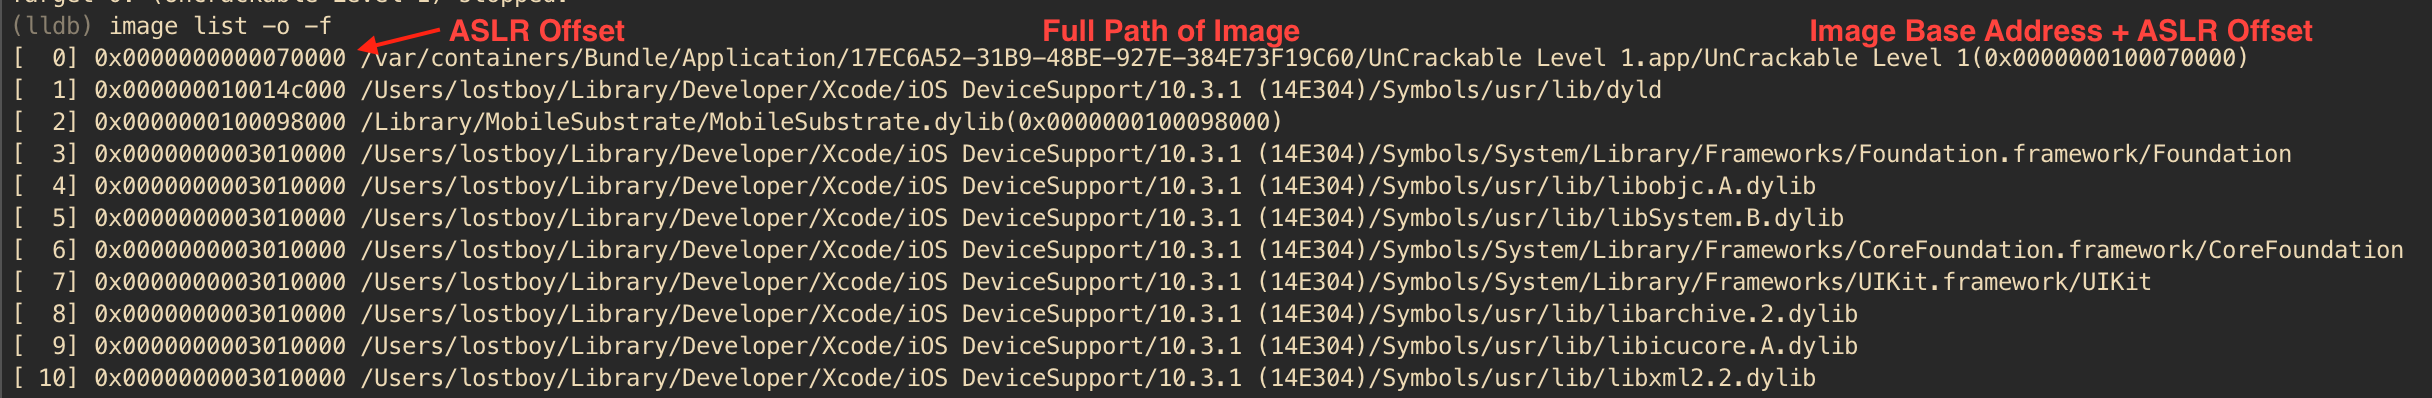
In the output, the first column contains the sequence number of the image ([X]), and the second column contains the randomly generated ASLR offset. In contrast, the 3rd column contains the full path to the image, and towards the end, the content in brackets shows the image base address after applying the ASLR offset to the original image base (0x100000000 + 0x70000 = 0x100070000). You will notice that the image base address 0x100000000 matches that in Ghidra. To obtain the effective memory address for a code location, we only need to add the ASLR offset to the address identified in Ghidra. The effective address to set the breakpoint will be 0x100004520 + 0x70000 = 0x100074520. The breakpoint can be set using the command b 0x100074520.
In the above output, you may also notice that many of the paths listed as images do not point to the file system on the iOS device. Instead, they point to a specific location on the host computer where LLDB is running. These images are system libraries for which debug symbols are available on the host computer to aid in application development and debugging (as part of the Xcode iOS SDK). Therefore, you may set breakpoints in these libraries directly by using function names.
After setting a breakpoint and running the app, execution halts when the breakpoint is hit. Now you can access and explore the current state of the process. In this case, you know from the previous static analysis that register X0 contains the hidden string; let's explore it. In LLDB, you can print Objective-C objects using the po (print object) command.
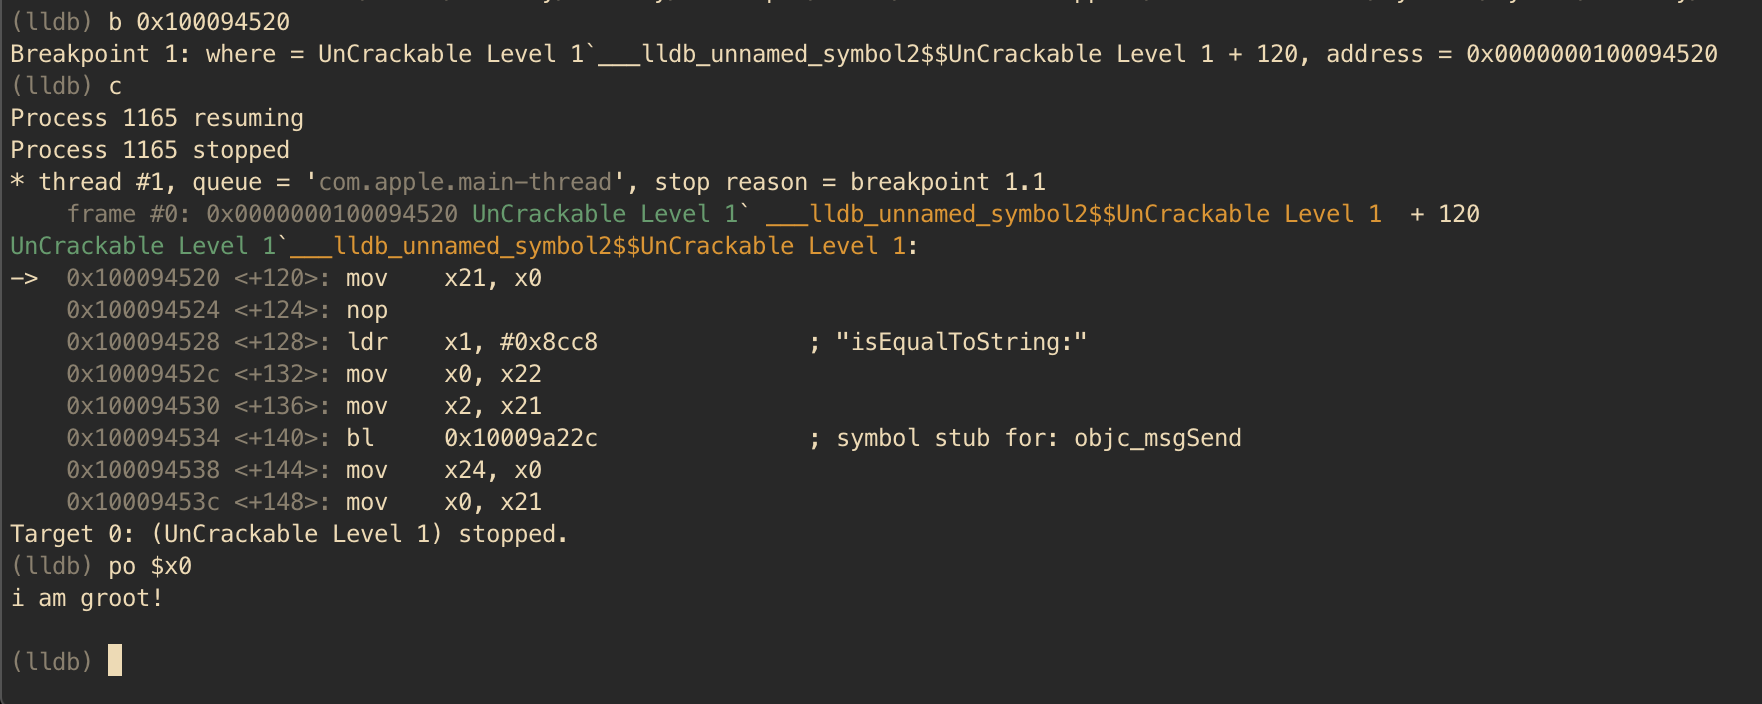
Voilà, the crackme can be easily solved with static analysis and a debugger. LLDB offers a wide range of features, including modifying register values, updating process memory, and automating tasks with Python scripts.
Officially, Apple recommends LLDB for debugging, but GDB can also be used on iOS. The techniques discussed above are also applicable when debugging with GDB, provided the LLDB-specific commands are replaced with GDB commands.
Tests
MASTG-TEST-0261: Debuggable Entitlement Enabled in the entitlements.plist MASTG-TEST-0082: Testing whether the App is Debuggable