MASTG-TECH-0077: Reviewing Disassembled Native Code
Analyzing disassembled native code requires a good understanding of the calling conventions and instructions used by the underlying platform. In this section, we examine ARM64 disassembly of the native code. A good starting point to learn about ARM architecture is available at Introduction to ARM Assembly Basics by Azeria Labs Tutorials. This is a quick summary of the things that we will be using in this section:
- In ARM64, a register is 64 bits in size and referred to as Xn, where n is a number from 0 to 31. If the lower (LSB) 32 bits of the register are used, then it's referred to as Wn.
- The input parameters to a function are passed in the X0-X7 registers.
- The return value of the function is passed via the X0 register.
- Load (LDR) and store (STR) instructions are used to read or write to memory from/to a register.
- B, BL, BLX are branch instructions used for calling a function.
As mentioned above, Objective-C code is also compiled to native code, but analyzing C/C++ native code can be more challenging. In Objective-C, various symbols (especially function names) help make the code easier to understand. In the above section, we've learned that the presence of function names like setText, isEqualStrings can help us in quickly understanding the semantics of the code. In the case of native C/C++ code, if all binaries are stripped, there may be very few or no symbols available for analysis.
Decompilers can help us in analyzing native code, but they should be used with caution. Modern decompilers are highly sophisticated, and among the many techniques they use, a few are heuristics-based. Heuristic-based techniques may not always yield correct results; for example, determining the number of input parameters for a given native function. Knowing and analyzing disassembled code, with assistance from decompilers, can make analyzing native code less error-prone.
We will analyze the native function identified in the viewDidLoad method from the previous section. The function is located at offset 0x1000080d4. The return value of this function is used in the setText function call for the label. This text is used to compare against the user input. Thus, we can be sure that this function returns a string or an equivalent.
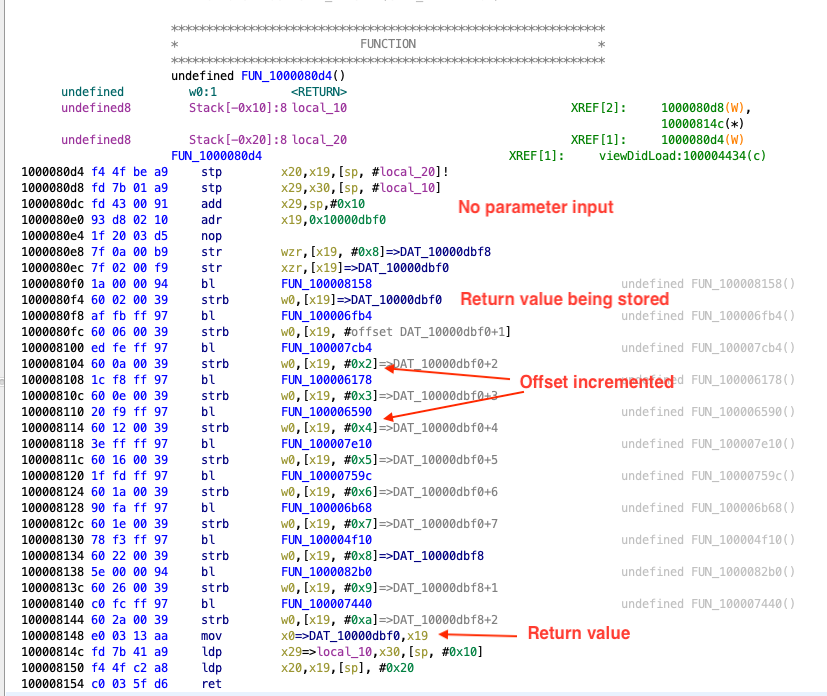
The first thing we observe in the function's disassembly is that it has no input parameters. The registers X0-X7 are not read throughout the function. Also, there are multiple calls to other functions, such as at 0x100008158 and 0x10000dbf0.
The instructions for one such function call are shown below. The branch instruction bl is used to call the function at 0x100008158.
1000080f0 1a 00 00 94     bl         FUN_100008158
1000080f4 60 02 00 39     strb       w0,[x19]=>DAT_10000dbf0
The return value from the function (found in W0) is stored at the address in register X19 (strb stores a byte to the address in register). We can see the same pattern for other function calls: the returned value is stored in the X19 register, and each time the offset is one more than the previous function call. This behavior can be associated with populating each index of a string array at a time. Each return value is written to an index of this string array. There are 11 such calls, and based on the current evidence, we can infer that the length of the hidden flag is 11. Towards the end of the disassembly, the function returns with the address to this string array.
100008148 e0 03 13 aa mov x0=>DAT_10000dbf0,x19
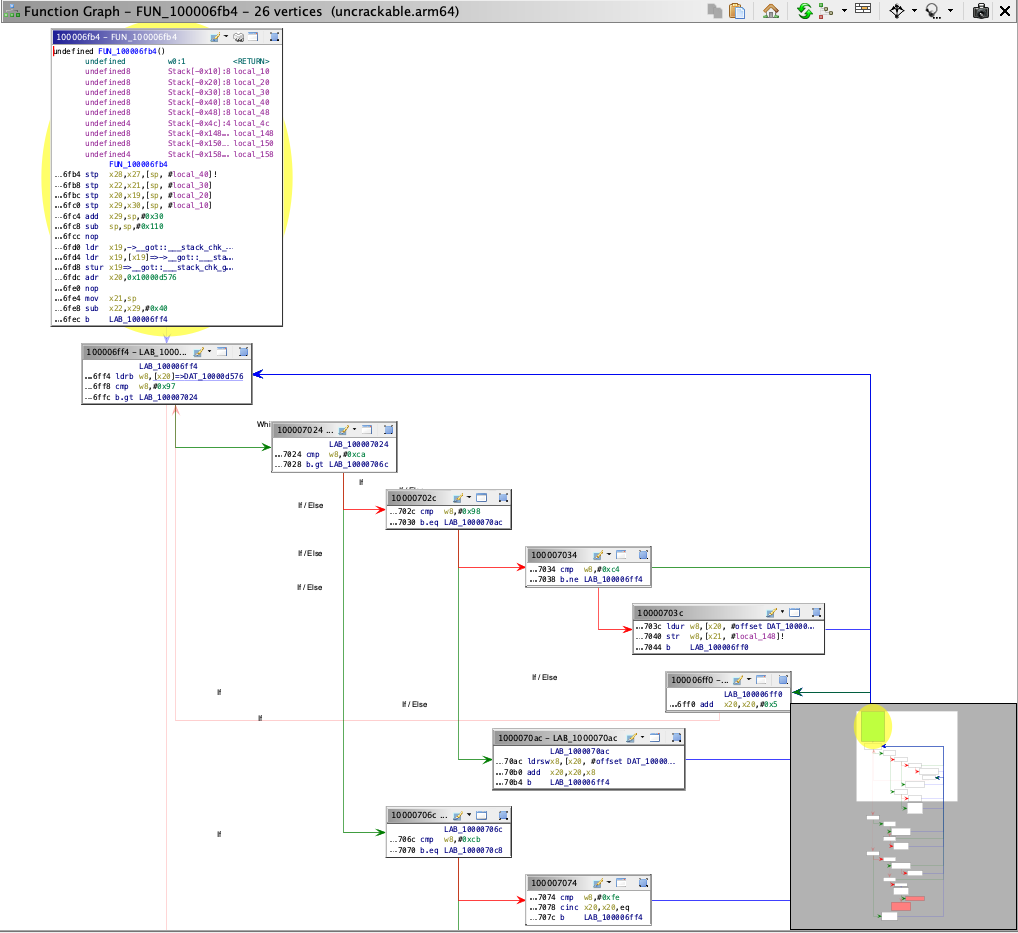
To determine the value of the hidden flag, we need the return values of the later function calls identified above. When analyzing the function 0x100006fb4, we observe that it is much larger and more complex than the previous one. Function graphs can be very helpful when analyzing complex functions, as they improve understanding of the function's control flow. Function graphs can be obtained in Ghidra by clicking the Display function graph icon in the submenu.
Manually analyzing all native functions in full will be time-consuming and may not be the most effective approach. In this scenario, using Dynamic Analysis on iOS is strongly recommended. For instance, by using techniques such as hooking or debugging the application, we can easily determine the returned values. Usually, it's a good idea to use a dynamic analysis approach and then fall back to manually analyzing the functions in a feedback loop. This way, you can benefit from both approaches simultaneously while saving time and effort.